Ask Your Data in Plain Words With AI: See the Query Behind Each Chart
With Josh Schultz ·
Answer. You can now ask your data in plain words, such as "which suppliers were late most often last quarter?", and an AI tool builds a dashboard from your connected data. Each chart shows its query, which is the exact instruction that counted the numbers. Reading the query is how you check that the AI counted what you meant.
The picture
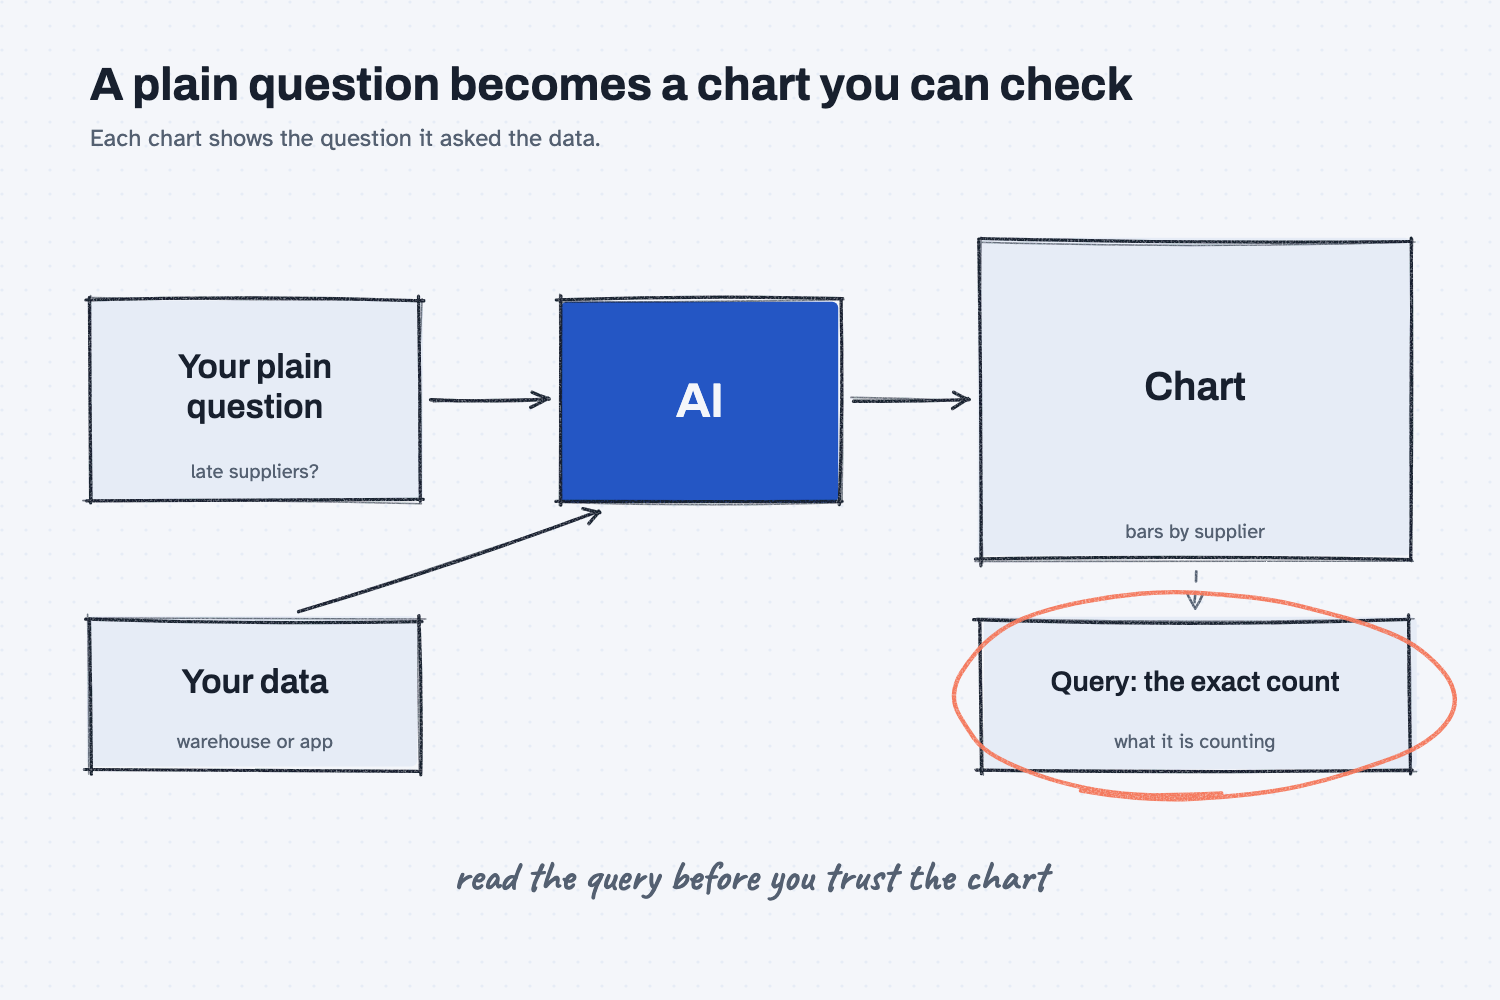
Start on the left, where your plain question and your data both feed the AI. The AI builds the chart on the right, and that chart is what most people look at. The box under the chart is the part to notice, because it holds the exact count the AI ran to get those bars. The note at the bottom is the habit to build, which is to read that box before you trust the chart above it.
Think of it like this
On a shop floor, a part travels with a work order traveler, which is the sheet that lists every step the part went through. If a finished part looks wrong, you do not argue about it. You pull the traveler, read the steps, and find where it went off.
A query is the traveler for a number. A chart tells you that Delta Freight Lines was late 14 times, but the query tells you how the AI arrived at 14, including what it called "late," which dates it compared, and which orders it left out. Without the traveler, you are trusting the finished part, and with it, you can inspect the work.
Why does it matter at work?
It matters because the plain question you typed is full of words that mean different things to different people, and the AI has to pick one meaning for each. It will pick one every time, and it will present the result with the same confidence whether it picked the meaning you had in mind or not.
Think of Hector Lee, the planner at Mesquite Ridge Metal Works, who asks his data tool which suppliers were late most often last quarter. A few seconds later he has a tidy bar chart. But "late" could mean after the promised date, after the original purchase order date, or after a date a supplier revised. "Last quarter" could mean a calendar quarter or a fiscal one. "Most often" could mean the most late orders or the highest share of late orders, and those can name different suppliers.
If Hector acts on the chart without reading the query, he might push back on a supplier who simply ships a lot of orders. If he reads it, he can spot the choice in one glance and ask the tool to count it the other way. This is the same habit that the lesson on showing the evidence rows teaches, applied to a chart.
How does it work?
Claude Data, which Anthropic describes on its help page as a way to turn questions about your company's data into dashboards, follows four steps, and each one gives you something to check.
You connect a source. The tool needs a place to look, such as a data warehouse or another app that is already connected. A data warehouse is a large, organized store of company records that IT usually looks after, so the connection is something to arrange with IT first. The lesson on how AI connects to your systems explains why a look-only connection is the safe place to start.
You ask what you want to know. The help page says that describing what you want to know, rather than which chart to draw, gets better results. Adding the meaning of your words helps most, for example "late means received after the promised date, counted by line."
The tool shows each chart's query. The help page says each chart shows its query so you can see exactly what it is counting, and it also shows when the data was last refreshed. You do not need to read a computer language fluently to use this. You are looking for the plain pieces, such as which date column it compared, which time period it chose, and whether it counted rows or shares.
You decide who sees it, and how. Dashboards start private. Without live sharing, each person who opens one loads the data through their own connections, so they only see what they already have access to. The help page describes live sharing, which it labels as a beta feature, in a different way: people see your results, even if they do not have access to the source.
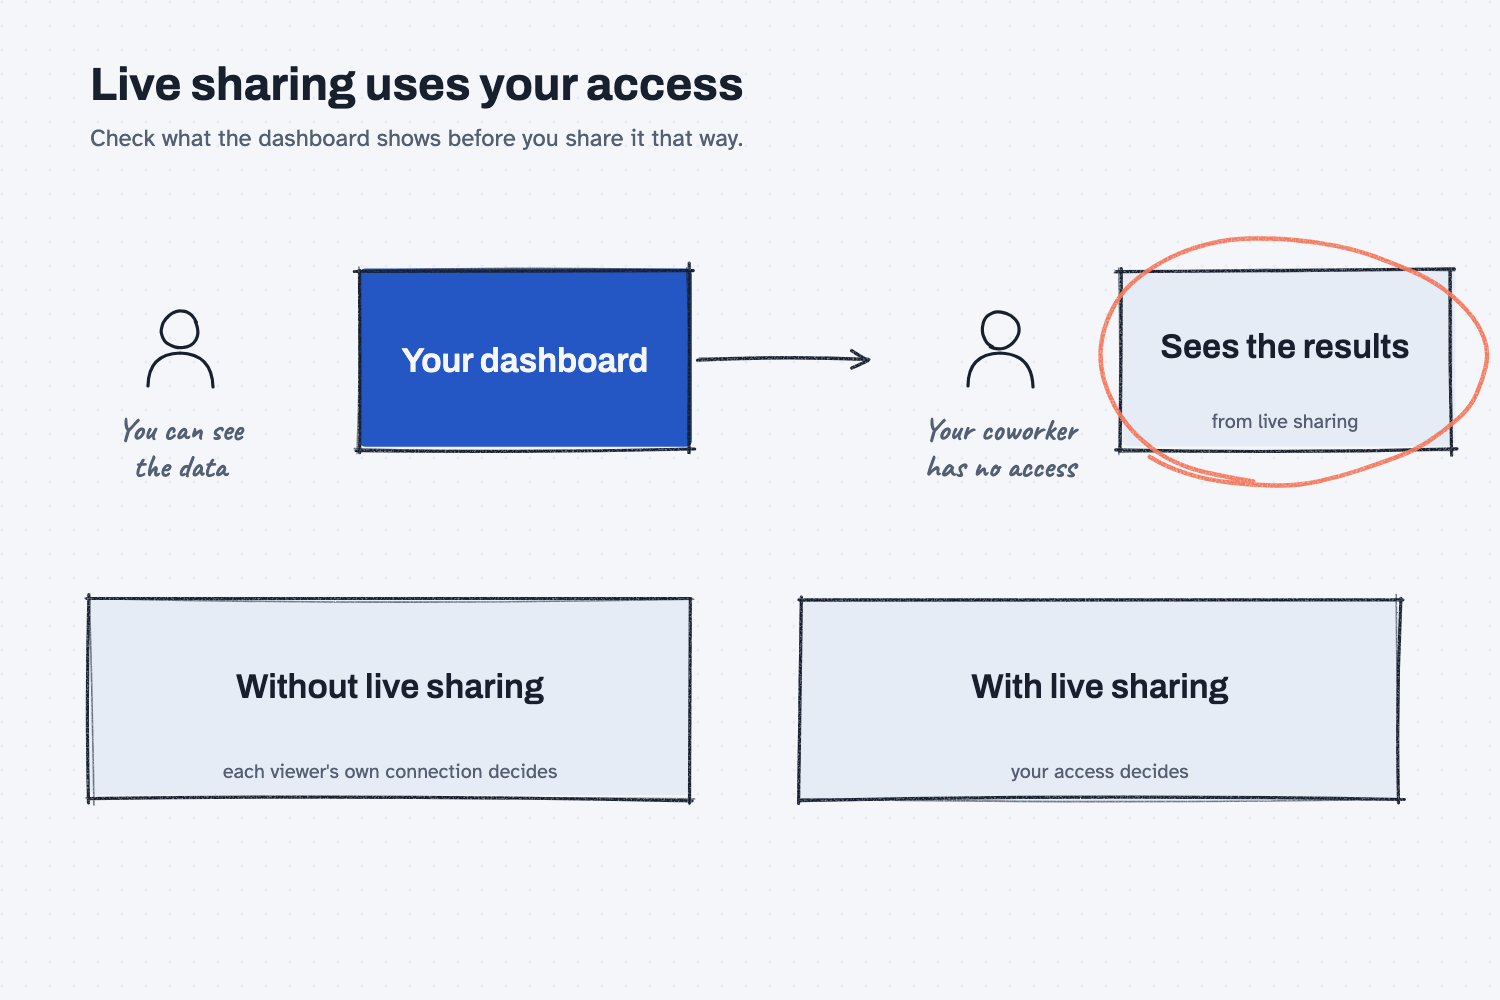
The picture shows why that choice matters. When your access decides, a coworker who was never given the data can still see what it says, so it is worth reading what a dashboard shows before you share it that way. For a chart that includes costs, margins, or customer prices, the safer default is to let each person's own access decide, and to ask IT before using live sharing.
Where do people get it wrong?
Most mistakes come from treating a clean chart as proof that the count was right.
- Never opening the query. A chart looks the same whether the count is right or slightly off, so the query is the only place the difference shows.
- Leaving the meaning of a word to chance. If you write "late" without saying what it means, the AI picks for you. Say it in the question.
- Skipping a sanity count. Pick one supplier and count its late orders by hand from the raw rows, then compare. The lesson on counting it before you argue shows how, and can AI do math explains why a check is worth the minute.
- Sharing live without looking. Check which charts a dashboard includes and who is on the list before you turn on live sharing.
Try this in 2 minutes
This test shows the idea without any data connection. It asks AI to explain why the query matters using the traveler comparison, and to name what a plain question leaves unclear. You can use any chat tool.
- Open a new chat and paste this:
I run purchasing at a small metal shop and I am not technical. A dashboard tool will answer the plain question "Which suppliers were late most often last quarter?" and show the query behind each chart. In 4 plain sentences, explain why seeing that query matters, using the comparison of a work order traveler that shows every step a part took. Then list 3 things the question leaves unclear that the query would have to settle, each in one short line.
- Read the explanation and check that it says what you gain from seeing the steps.
- Copy the three unclear items, because they are the questions to ask any time a tool answers "who was late."
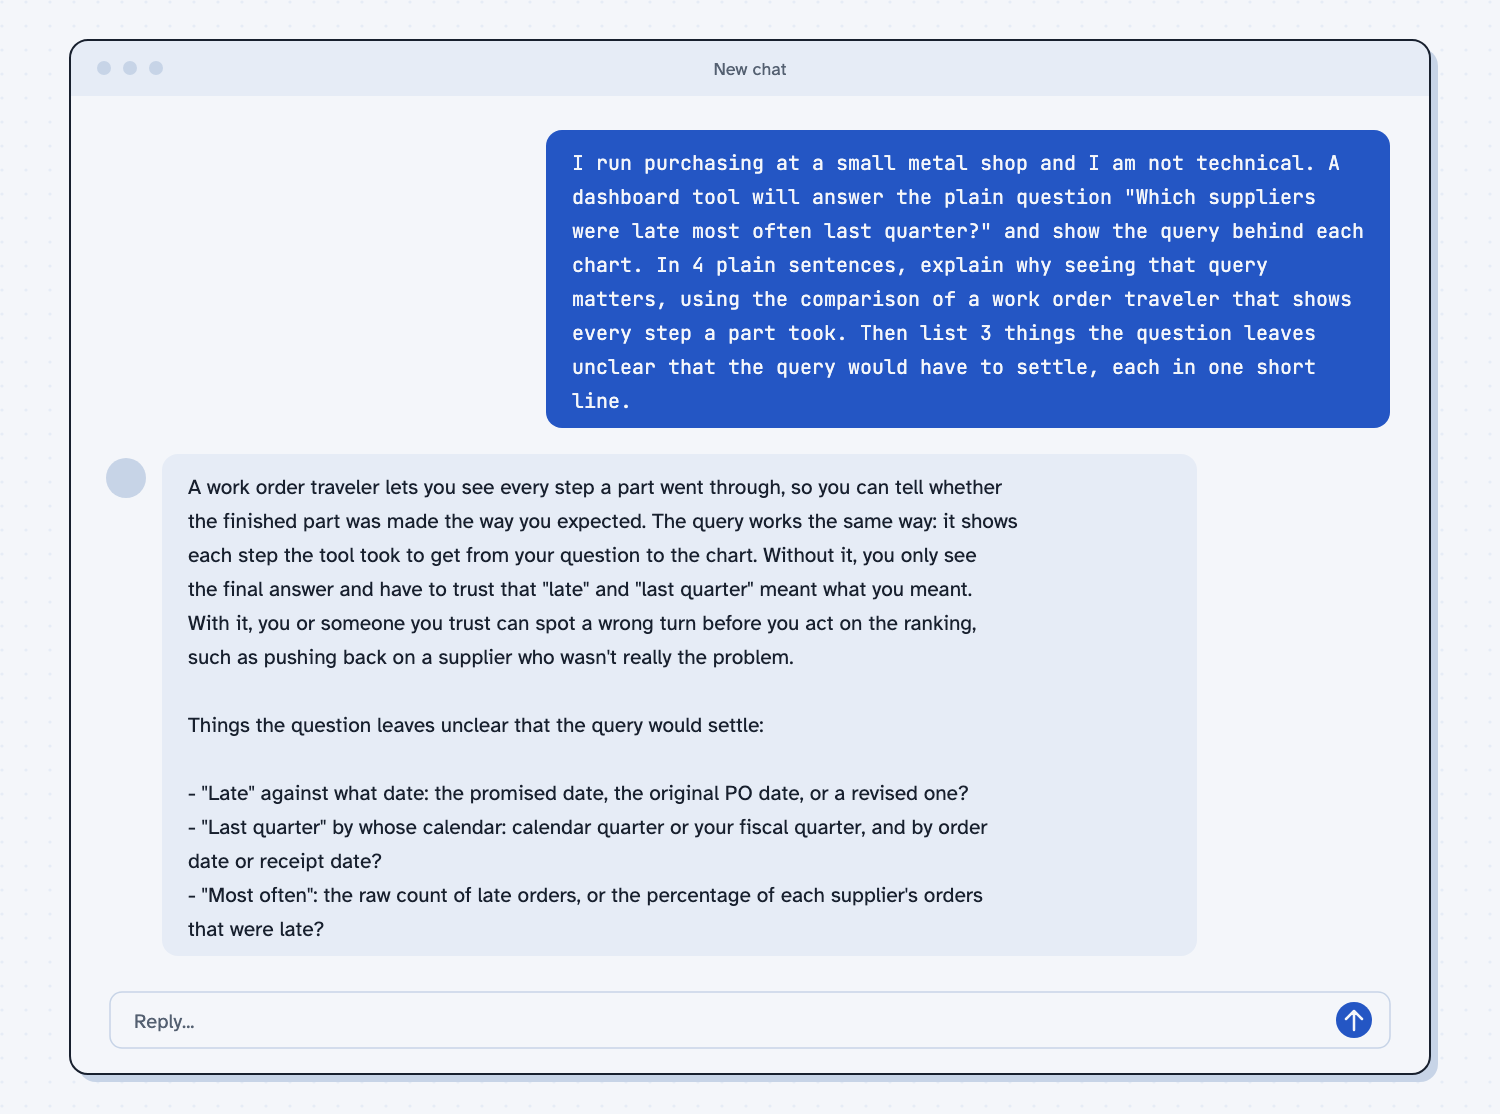
When I tried this, the reply said that without the query "you only see the final answer and have to trust that 'late' and 'last quarter' meant what you meant." The three unclear items were what date counts as late ("the promised date, the original PO date, or a revised one?"), whose calendar defines the quarter, and whether "most often" means "the raw count of late orders, or the percentage of each supplier's orders that were late?" Any one of those could change which supplier tops the chart.
Frequently asked questions
What is a query?
A query is a precise request to a database, such as "count the orders where the received date is after the promised date." In a dashboard tool, the query is the instruction behind each chart, and it shows how the number was made.
Do I have to read computer code to use this?
No. You are only looking for plain pieces such as the date it compared and the period it used. If you are unsure what a line means, paste it into a chat and ask for a plain-language explanation.
Is this the same as Claude's built-in spreadsheet?
No. Claude Sheets is a separate spreadsheet inside Claude, and its help page says it cannot pull live data from connected apps. Dashboards are for questions about connected data, and sheets are for cells you and Claude edit together.
Who can see my dashboard?
It starts private. After that, it depends on how you share it, and live sharing lets people see results from data they cannot reach, so check with IT before using it for sensitive numbers.
Use it today
- Have Claude build your quote report: a report you can check line by line, with the same read-the-steps habit.
- Related idea: Show the evidence rows.
- Related idea: Count it before you argue.
- Related idea: How AI connects to your systems.
From my training: this site teaches a chart as a claim, so the first question is always what the count was.