- Claude
AI app. An AI chat app. You type or paste text, or add a file, and it writes back.
Answer. To have Claude build a quote report, attach your saved quote files, describe the page you want in plain words, and ask Claude to write a script that reads every file in the folder. Claude writes it, runs it, and hands you the page. To change the report later, describe the new page, not the code, one change at a time.
Time and cost. 45 minutes the first time, including four changes. $0 to practice with the sample files on the free Claude plan. Who this is for. Buyers and estimators who saved their quotes as data and want a report that comes out the same way every month, without learning to code.
In Compare supplier quotes the same way every time, you got a script called build_comparison.py that turns quote data into a comparison page. You may have wondered where it came from. I described the page I wanted to Claude, Claude wrote the script, and I checked it against sample quotes until every number was right. This guide shows you how to do the same thing yourself, so you are never stuck waiting for someone to build or fix a report for you.
The report we build here is a price history. It reads every quote you have saved, across many RFQs, and shows how each supplier's price for each part has moved over time. Then we change it four times by saying what we want to see, fix it once when it breaks, and save it so it runs the same way every time.
What will I learn besides building a quote report?
You will learn six habits that work for any report you want Claude to build, from a freight bill summary to a late PO list. Each one has a short "why" later in this guide.
- Have AI build the tool once, then run it for free. The script does the work every month, not the chat.
- Describe the output, not the code. You say what the page should show. Claude works out the code.
- Show an example of what you want. A small typed table or a screenshot with a circle beats a long description.
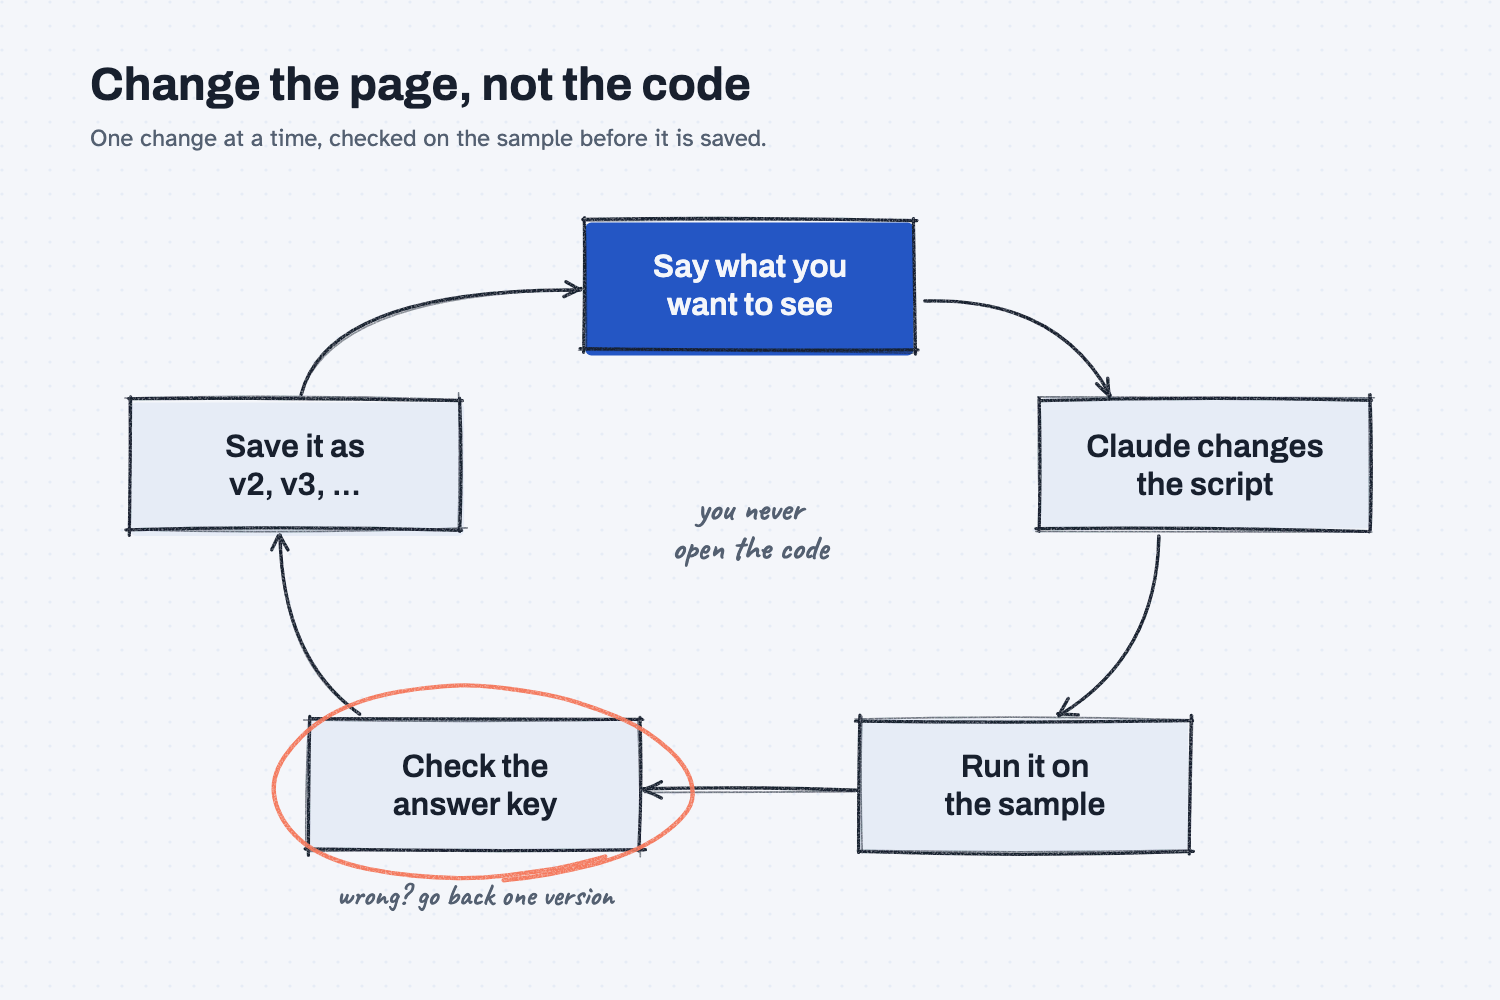
- Make one change at a time and check it against an answer key. Then you always know which change broke something.
- Save every working version. If a change goes wrong, you go back one version instead of starting over.
- Make bad data stop the script. A loud stop with a plain message is safer than a page with a quiet mistake in it.
What is a script, and why not just ask the chat each time?
A script is a small program, a list of exact steps a computer follows the same way every time. A chat writes your report fresh each time, so columns and even numbers can drift. A script gives the same page from the same files every time, and it costs nothing to run again.
People call this deterministic, which means the same input always gives the same output. That is what you want from a report you will compare month to month. So the trade is simple: you use AI once to build the tool, and then the tool does the job for free. You never open the script yourself. Claude reads it, changes it, and runs it for you.
What do I need before I start?
You need Claude and the sample files below. There is nothing to install.
- Claude at claude.ai. The free plan works for practice. Claude must be able to run code, so in Settings, then Capabilities, turn on Code execution and file creation if it is off.
- The sample quote history: quote-history-sample.zip. Unzip it. Inside are five saved quote files, one for each past RFQ from February to November for the made-up company Mesquite Ridge Metal Works, plus an
answer-keyfolder and abrokenfolder you will use in Step 5.
Each quote file is JSON, which is a plain-text format of labels and values that programs can read. These files use the same quote shape as Guide 51, so if you followed that guide, your own saved quotes-*.json files will work here too. The shape is what makes this possible: because every file has the same blanks, one script can read all of them. (Why a fixed shape matters.)
Safe use. Real quotes hold prices and supplier names. Check your company rules before you attach them to any AI tool. Practice with the sample files first. Read the safe use notes.
How do I have Claude build a quote report?
Attach the saved files, describe the page you want with the build prompt, check the first page against the answer key, then change, fix, and save it. Seven steps.
Step 1. Put your saved quote files in one folder
Make a folder called quote-report, and put the quote-history folder from the sample zip inside it. Every RFQ you save from now on goes into quote-history, which is the whole point: the script will read whatever is in that folder, so next month's RFQ just gets dropped in.
Step 2. Attach the files and describe the page you want
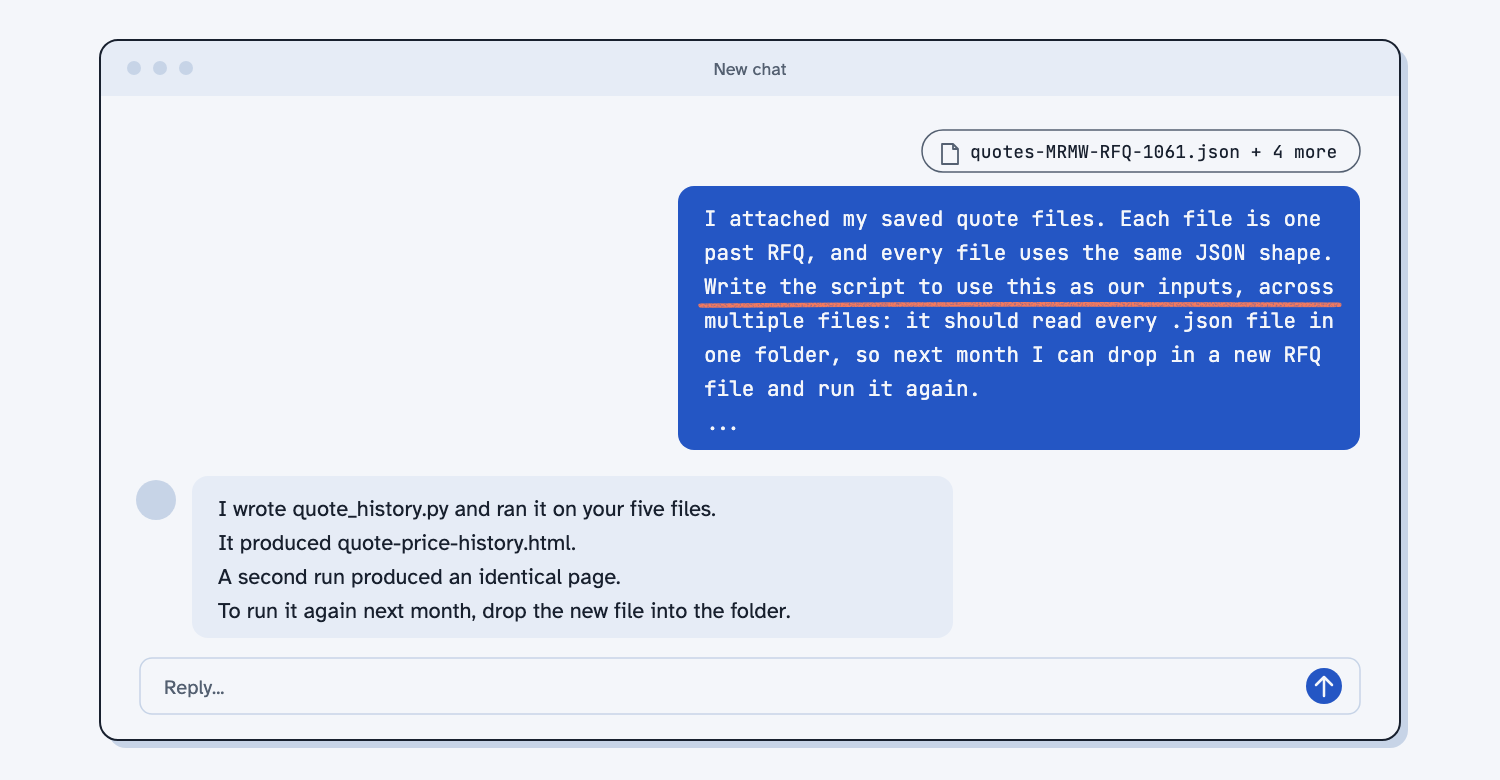
Open a new chat at claude.ai. Click the + button and choose Upload a file, or drag the five quotes-MRMW-RFQ-*.json files from quote-history onto the chat. Do not attach the broken or answer-key folders yet. Then paste the build prompt below and send it.
The most important line is the third one: "Write the script to use this as our inputs, across multiple files." That tells Claude the files you attached are examples of the shape, and the script must read every file in a folder, not just these five. The rest of the prompt is a plain list of what goes in, what comes out, and eight rules that keep the report honest.
I attached my saved quote files. Each file is one past RFQ, and every file uses the same JSON shape. Write the script to use this as our inputs, across multiple files: it should read every .json file in one folder, so next month I can drop in a new RFQ file and run it again.

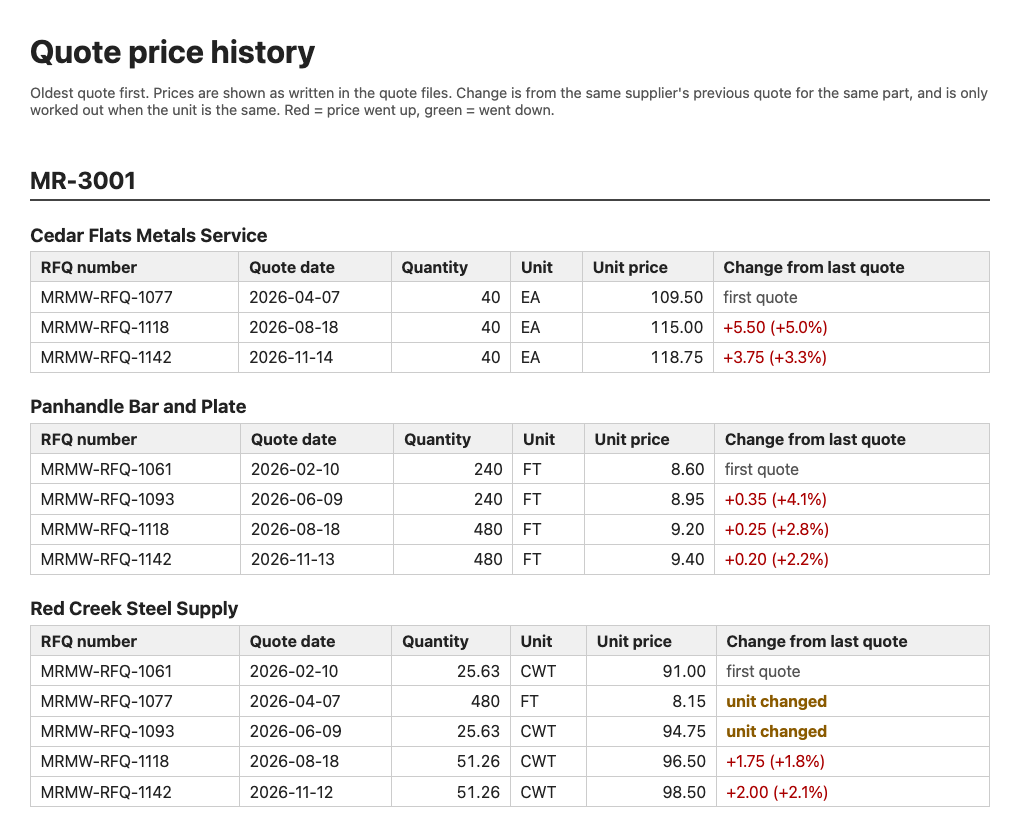
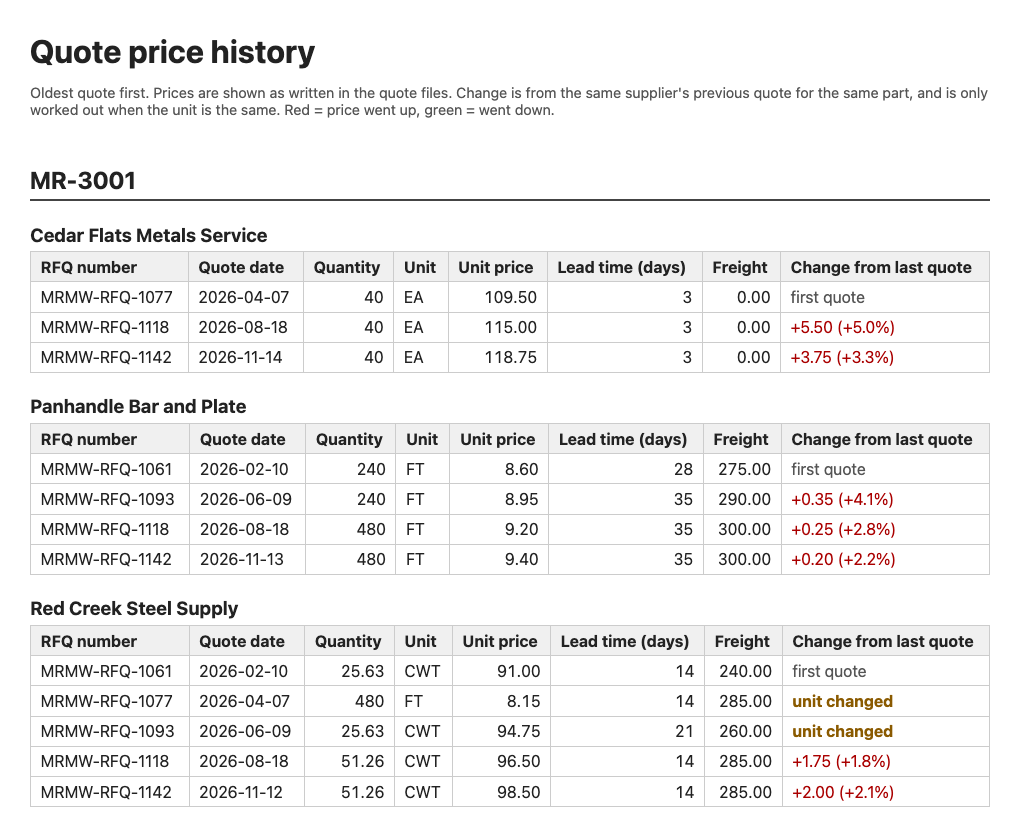
What comes out: one HTML page named quote-price-history.html that I can open in my browser. For each of our part numbers, show a price history table for each supplier: RFQ number, quote date, quantity, unit, unit price, and the change from that supplier's last quote. Oldest at the top.

Rules for the script:
1. Write it in Python, in one file named quote_history.py. It must run with no internet and nothing to install.
2. At the top, write a few plain lines that say what goes in, what comes out, and how to run it.
3. Read every .json file in the folder I name. Skip lines that have no part number of ours.
4. Only compare prices that use the same unit from the same supplier. If the unit changed, say "unit changed" instead of working out a change.
5. Do not round, convert, or fix any number from the files. Show prices to 2 decimals.
6. If a file has bad data, stop and print one plain message that names the file, the field, and the value. Do not guess and do not skip it quietly.
7. Same files in, same page out, every time. Do not put today's date or anything random on the page.
8. At the bottom of the page, list the files it read.

Then run it on the files I attached and give me the HTML page. In plain words, with no code, tell me what the page shows and anything in my data that looked odd.
Claude writes quote_history.py, runs it, and gives you quote-price-history.html to download. Its reply also explains the page in plain words and lists anything odd it saw in the data. On the sample, it pointed out that Red Creek priced bar by weight (CWT), then by the foot, then by weight again, and that Cedar Flats added a saw cut charge on two quotes that was not on the RFQ.
Download both files. Open the page by double-clicking it, and it opens in your browser.
Step 3. Check the first page against the answer key
Check the page before you trust it, and check it against something you know is right. The sample comes with an answer key, answer-key/price-history.md, which lists every correct row. Open it and compare three rows by hand.
- Red Creek, MR-3001, RFQ 1142: 98.50 per CWT, up 2.00 from 96.50.
- Panhandle, MR-3002, RFQ 1093: 380.00 EA, up 8.00 from 372.00.
- Red Creek, MR-3001, RFQ 1077: priced per FT, so the page says "unit changed" instead of a change.
Then attach the page and the answer key to the chat and send the check prompt below, which has Claude go through every row for you. (How to test an AI tool against answers you know.)
I attached the page my script made from the sample quote files, and the answer key for those same files (price-history.md).
Check the page against the answer key, row by row: part, supplier, RFQ number, unit, unit price, and the change from the last quote.
Use the answer key as the truth. Do not fix anything and do not change the script.
Reply with a short table of every row that does not match, with what the page says and what the answer key says. If every row matches, say "All rows match" and how many rows you checked.
On the sample, Claude replied "All rows match. I checked 24 history rows," and it noted that the page shows percents to one decimal (+5.0%) where the key uses two (+5.02%). That is rounding on the page, not a wrong number. If a row does not match, do not move on. Go to Step 5.
Step 4. Change the page by describing what you want to see
To change the report, describe the page you want, not the code. Say it the way you would say it to a coworker, and show a small example: a typed mini table, or a screenshot with a circle on it. (Why you describe the output, and why an example helps.) Ask for one change at a time, so if something goes wrong you know which change did it. (One change at a time.)
Use the change prompt below. Fill in what you want to see, the example, and the next version number. Rule 5 asks Claude to say which numbers on the page moved, which is how you catch a change that touched more than you asked for.
I attached quote_history.py and my quote files. Change the page it makes, one change only:

[WHAT YOU WANT TO SEE, in plain words]

Here is an example of what I mean:
[A SMALL TYPED TABLE, OR A SCREENSHOT WITH A CIRCLE ON IT]

Rules:
1. Change only what I asked for. Keep every other number, column, and the layout the same.
2. Do not change how the prices or the changes are worked out unless I asked.
3. Save the new script as quote_history_v[N].py and keep the old one as it is.
4. Run it on the attached files and give me the new page.
5. Then tell me in plain words, with no code: what you changed, and which numbers on the page moved, if any.
Here are four real changes, one at a time, each starting from the version before it.
Change 1: "Add two columns to every table, after Unit price: the lead time in days and the freight cost from that quote." The example was one typed row: | MRMW-RFQ-1142 | ... | 98.50 | 14 | 285.00 |. Claude added both columns and replied, "None moved. I ran the old and new scripts on the same files." It also noted that Red Creek's freight is an estimate and Panhandle's is "around $300", so the page shows those as plain numbers.
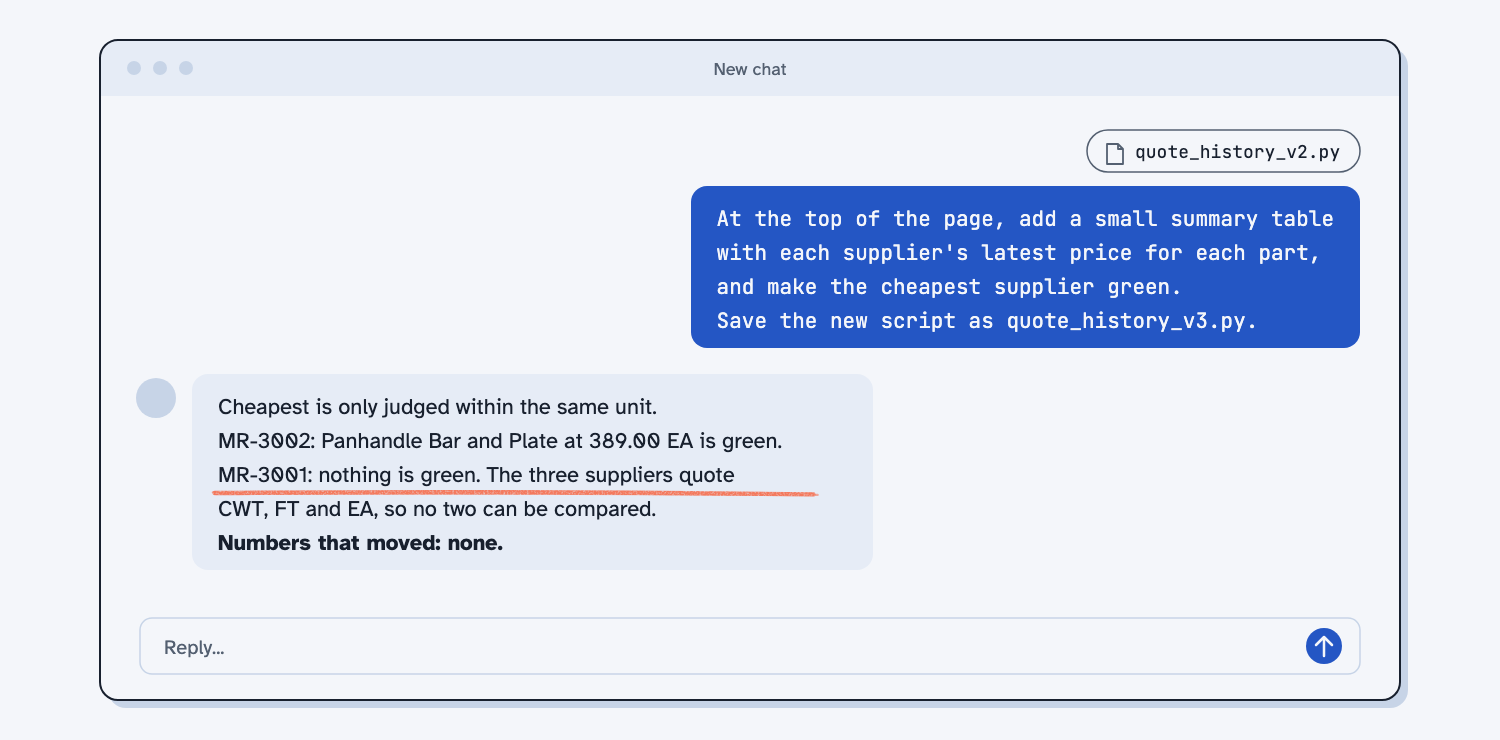
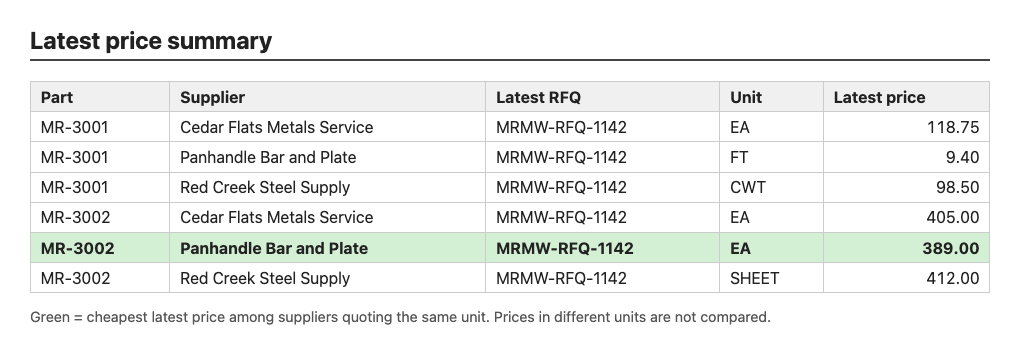
Change 2: "At the top of the page, add a small summary table with each supplier's latest price for each part, and make the cheapest supplier green." This one taught me something. Claude made MR-3002 green for Panhandle at 389.00 EA, but it made nothing green for MR-3001, because the three suppliers quote that bar in three different units (CWT, FT, and EA). It would not convert units on its own, since rule 5 says not to change numbers, so it told me instead of guessing. That is the right call. If you want bar prices compared, tell Claude how your units relate, for example "one bar is 12 ft and about 128 lb."
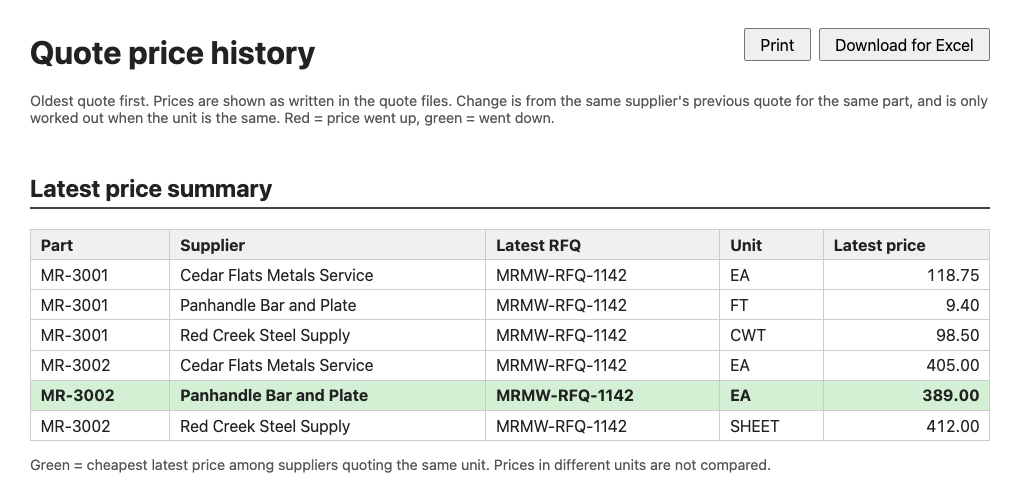
Change 3: "Add two buttons at the top right of the page: Print and Download for Excel." The example listed the columns I wanted in the Excel file. Claude added both buttons and said, "I haven't clicked the buttons in a browser, so the button behavior itself is untested." So I clicked them. Download for Excel saved a CSV file (a plain spreadsheet file Excel opens) with all 24 rows. One catch: the change column comes into Excel as text, so you cannot sort by it. If you need that, ask for the change as its own number column.
Change 4: "Put each part on its own tab, so I click MR-3001 or MR-3002 at the top and only see that part." For this one I attached a screenshot of the page with the two part headings circled and the words "make each part its own tab" written next to them. A picture like this is the fastest way to point at something on a page.
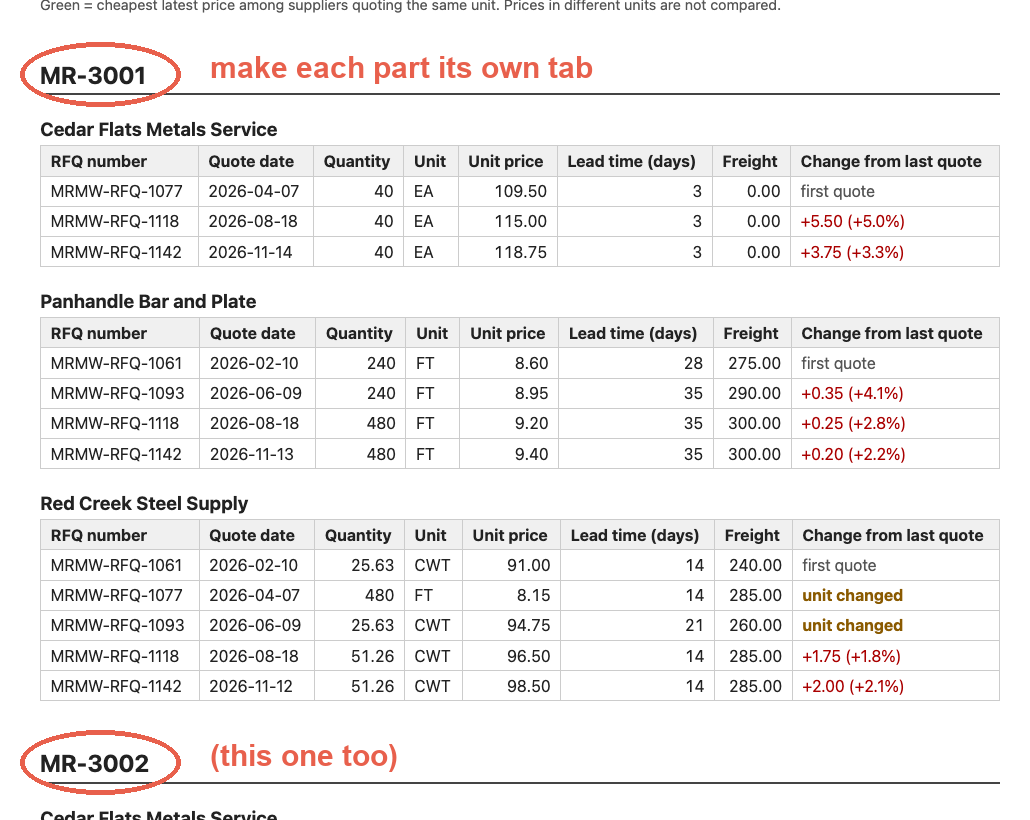
Claude added the tabs, kept Print printing every part, and said it compared all 222 table cells against the version before and none moved. Clicking the MR-3002 tab shows only the plate history.
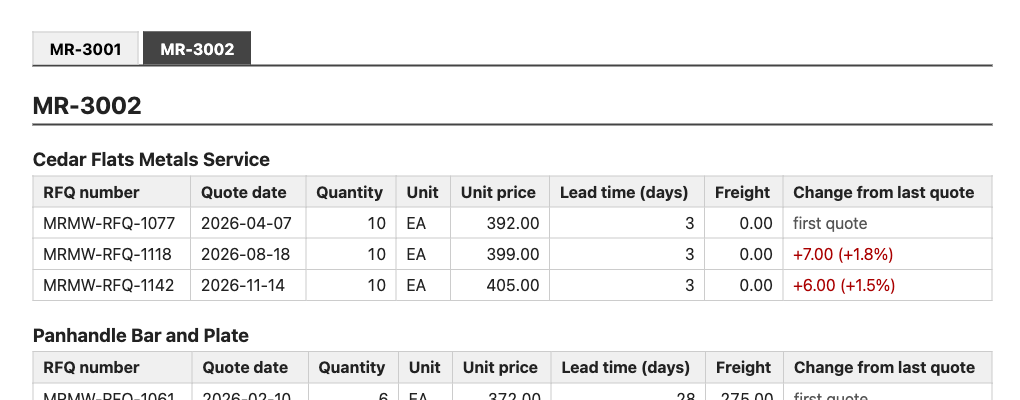
After every change, run the check prompt from Step 3 again. Each of these four versions still matched the answer key on all 24 rows.
Step 5. Fix it when it stops or looks wrong
When the script stops or the page looks wrong, paste the exact message or a screenshot, and say what you expected to see. Claude can only fix what it can see, so the exact words matter more than your summary of them.
To practice, copy quotes-MRMW-RFQ-1150.json from the broken folder into quote-history, and ask Claude to run the script again. The script stops with this message, because of rule 6 in the build prompt:
Bad data in file quotes-MRMW-RFQ-1150.json: field [0].quote.date has value '12/01/2026' (must be a real date written YYYY-MM-DD). Nothing was written.
That is the script doing its job. It found a date written the wrong way and refused to make a page with it. Paste the message into the fix prompt below and send it with the files.
I ran quote_history.py on my quote files and it did not do what I expected. I attached the script and the files.

What I saw (the exact message, or a screenshot):
[PASTE THE MESSAGE OR ATTACH THE SCREENSHOT]

What I expected:
[ONE OR TWO PLAIN SENTENCES]

First, tell me in plain words what went wrong and whether the problem is in a data file or in the script.
If it is a data file: fix only the bad value or values in that file, tell me each old value and new value, and do not change the script to accept bad data.
If it is the script: fix only that problem, save it as a new version, and keep the old one.
Then run it again on all the files and give me the page. Tell me which numbers on the page moved, if any.
Claude said the problem was in the data file, not the script, and it found a second bad value the first message did not mention: the MR-3001 price was typed as "$99.25", which is text, not a number. It fixed only those two values, showed the old and new value for each, and left the script alone. It also told me it had guessed that 12/01/2026 means December 1, not January 12, gave its reasons, and asked me to confirm. Always confirm a guess about your own data.
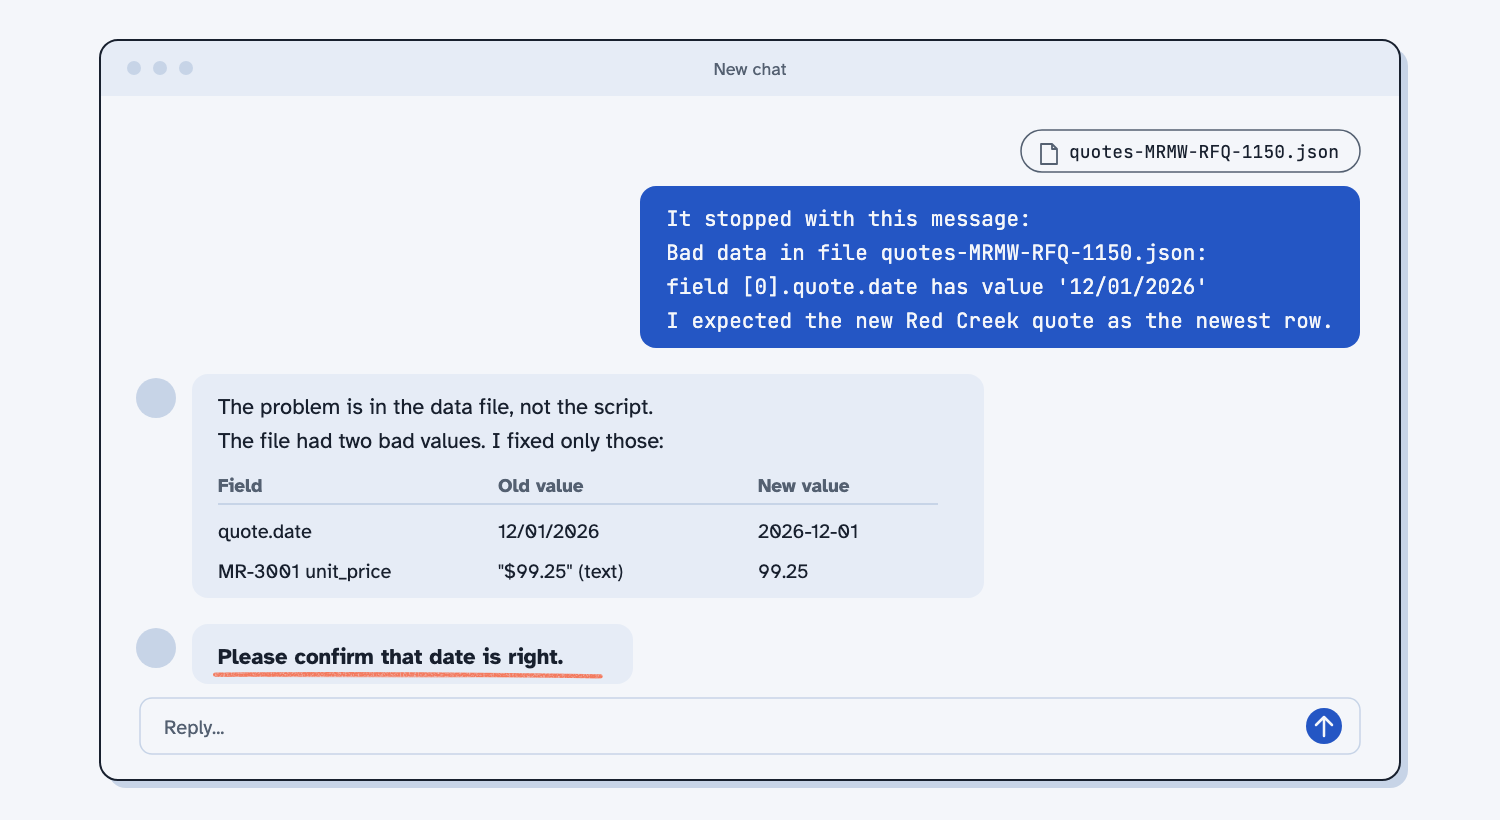
The page then showed RFQ 1150 as the newest Red Creek row.
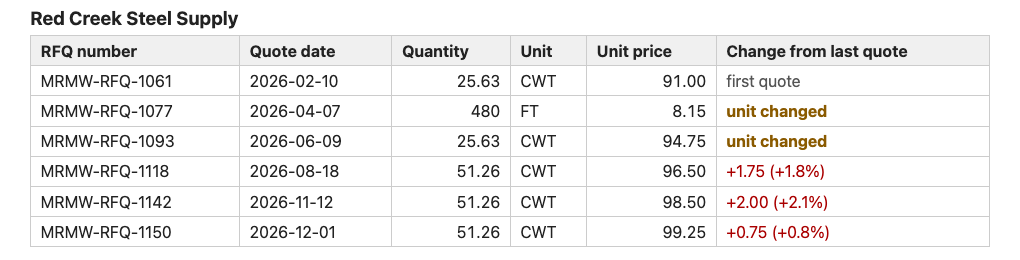
If the page looks wrong instead of stopping, take a screenshot, circle the wrong part, and write what you expected next to it, for example "this should be 412.00, not 41.20." The same prompt works. When the fix is in the script, Claude saves it as a new version, and you fix the instructions once instead of the answer every time.
Step 6. Save each working version with a short note
Every time a change passes the check, save the script with its version number and add one line to a note that says what changed. Keep them in a versions folder inside quote-report, next to the answer key. (Save every working version, and keep a short record of what changed.)
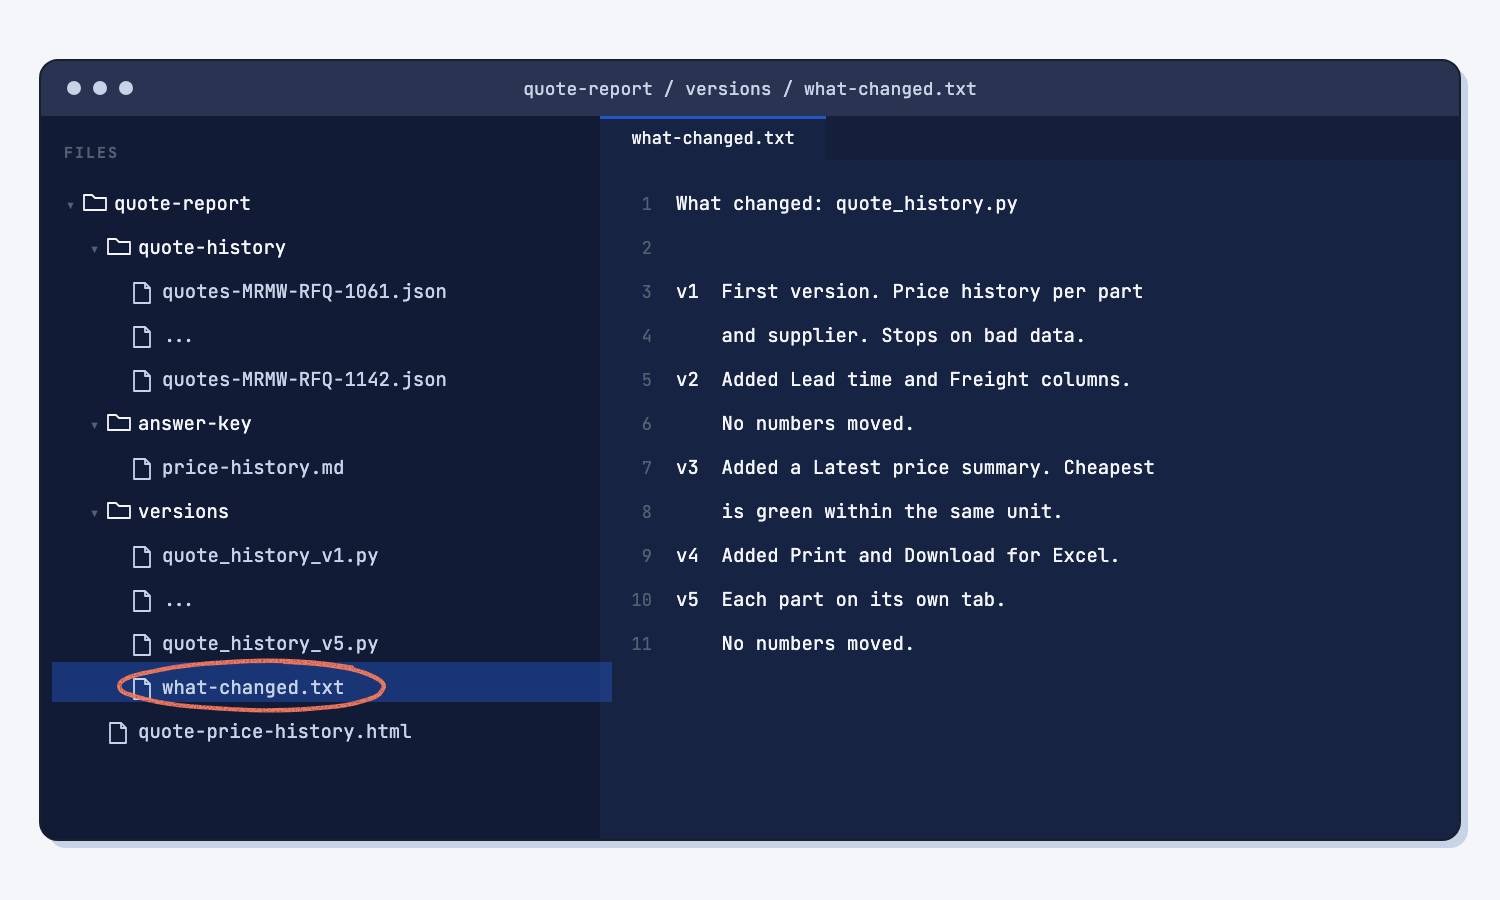
Three rules keep this safe. Always run a new version on the sample files and check the answer key before you run it on real quotes, because the sample is where you know the right answer. Keep the sample and its answer key forever, since they are your test for every future change. And if a version goes wrong, go back to the last one that passed instead of asking Claude to patch a patch. My note for the four changes is in what-changed.txt.
Step 7. Save it as a Claude skill so it runs the same way every time
When you are happy with a version, turn it into a Claude skill, which is a saved set of instructions Claude loads when the job comes up. (What is an AI skill?) The skill carries the script inside it, so Claude runs your checked script instead of writing a new one. Attach your last good version and send this prompt.
I attached quote_history_v5.py. It works, and I checked it against my sample answer key. Turn it into a Claude skill so it runs the same way every time.

1. Make a folder named quote-history with a SKILL.md file and the script inside a scripts folder. Do not change the script.
2. In SKILL.md, write short, plain steps: find the folder of quote .json files, run the script on that folder, give me the page, and if the script stops, show me its message and ask which value to fix. Never write or change the page by hand.
3. The description at the top should say when to use it, in the words I would use, like "update my quote price history" or "show price history for a part".
4. Zip the folder as quote-history.zip and give me the zip.
Claude gives you quote-history.zip. In the Claude app, go to Settings, then Capabilities, then Skills, and upload the zip. After that, you attach your quote files and say "Update my quote price history." When I did that with the skill installed, the page it built was identical, byte for byte, to the version I had checked. You can also download my finished skill: quote-history.zip.
What does good look like?
With the five sample files, the price history shows these latest prices and changes. Answer key, sample data. The numbers come from answer-key/price-history.md. You can open the finished sample page to see the last version.
| Part | Supplier | Latest unit price | Unit | Change since first quote in that unit |
|---|---|---|---|---|
| MR-3001 bar | Red Creek Steel Supply | 98.50 | CWT | +8.24% (from 91.00) |
| MR-3001 bar | Panhandle Bar and Plate | 9.40 | FT | +9.30% (from 8.60) |
| MR-3001 bar | Cedar Flats Metals Service | 118.75 | EA | +8.45% (from 109.50) |
| MR-3002 plate | Red Creek Steel Supply | 412.00 | SHEET | +5.91% (from 389.00) |
| MR-3002 plate | Panhandle Bar and Plate | 389.00 | EA | +4.57% (from 372.00) |
| MR-3002 plate | Cedar Flats Metals Service | 405.00 | EA | +3.32% (from 392.00) |
Every supplier's price went up on every comparable quote this year. Red Creek's two "unit changed" rows are correct, because a price per foot cannot be compared with a price per hundred pounds without a conversion you choose.
What can go wrong?
These all came up while building this report. None of them is a reason to stop, but each one is a reason to check.
- "Cheapest" across different units. Claude would not pick a cheapest bar supplier, because the prices are per CWT, per foot, and per bar. Tell it how your units relate if you want them compared.
- Two words for one unit. Red Creek says SHEET and the others say EA for the same plate, so Claude treats them as different. Say "treat SHEET and EA as the same" if they are the same to you.
- Untested buttons. Claude said plainly that it had not clicked the new buttons or tabs. Asking AI to check its own work helps, but it cannot click for you. Click everything yourself before you save the version.
- The Excel file sorts badly. The change column came in as text. Ask for a separate number column if you sort by it.
- One stop, two problems. The script stops at the first bad value it finds, so a second bad value only shows on the next run.
- A guess about your data. AI fills gaps instead of leaving them. Claude read 12/01/2026 as December 1 and asked. Confirm every guess like that before you save the file.
- The new page has the old name. Each version writes
quote-price-history.html, so a new page can replace the last one in your downloads. Rename the page with its version number when you save it. - Claude changes more than you asked. It did not happen in these runs, but it can. That is why rule 1 says "change only what I asked for" and rule 5 asks which numbers moved.
How do I check the answer?
Check every new version on the sample before you run it on real quotes, and check the page, not Claude's description of it.
- Three rows by hand against
answer-key/price-history.md. - The check prompt, which should say all 24 rows match.
- Click every button and tab yourself.
- Run it twice and make sure nothing on the page changes.
Why does this way work?
It works because you spend AI once, on building and changing the tool, and the tool does the repeat work the same way every time. Here is the short "why" behind each habit.
Have AI build the tool once, then run it for free. (Use AI to build the tool.) Asking a chat for the report every month is like hand-measuring every part. Building the script is like building a jig: it takes care up front, and then every part comes out the same.
Describe the output, not the code. (Describe the output, not the code.) You know what a good report looks like, and Claude knows how to write the code. When you describe the page, each of you does the part you are good at, and you can judge the result just by looking at it.
Show an example of what you want. (Show AI an example.) "Make it look better" can mean anything. A typed row or a circled screenshot means one thing, so you get what you meant on the first try more often.
Make one change at a time and check it against an answer key. (One change at a time.) If you ask for four changes at once and a number moves, you cannot tell which change moved it. One change, one check, and the answer key tells you right away.
Save every working version. (Save every working version.) A saved version is a known good point. When a change goes wrong, going back one version takes a minute, while untangling a pile of patches can take an afternoon.
Make bad data stop the script. (Make bad data stop the script.) A script that guesses at "$99.25" or a date written two ways will make a page that looks fine and is wrong. A plain stop message that names the file and the value is annoying for a minute and saves you from a bad buying decision.
Frequently asked questions
Do I need to know how to code to do this?
No. You attach files and describe pages in plain words. Claude writes, changes, and runs the script, and you judge the page by looking at it and checking it against the answer key. You never have to open the script.
Why attach the JSON files instead of just describing them?
The files show Claude the exact shape, every label and every kind of value, so it does not have to guess. Saying "use this as our inputs, across multiple files" then tells it to write for every file in the folder, not only the ones you attached.
Can I use this for a report that is not about quotes?
Yes. Any set of files in one shape works: POs, freight bills, receiving logs. Save them in one shape first, as Guide 51 does with quotes, then use the same build prompt with your own "What comes out" paragraph. (Why one shape matters.)
What if Claude's change breaks the page?
Go back to the last version that passed the check and ask again, with a clearer example. If the page stops with a message, use the fix prompt in Step 5 with the exact message pasted in.
Can I use ChatGPT or Copilot instead?
Yes, if the tool can run code and give you files back. The prompts are plain text. The script is plain Python, so it runs the same no matter which AI wrote it. If your tool cannot run code, someone with Python can run it with python3 quote_history.py quote-history.
Take this with you
Five prompts and a finished skill. Together they let you build any report from saved files, change it, fix it, and keep it.
1. Build it. Attach your files and describe the page.
I attached my saved quote files. Each file is one past RFQ, and every file uses the same JSON shape. Write the script to use this as our inputs, across multiple files: it should read every .json file in one folder, so next month I can drop in a new RFQ file and run it again.

What comes out: one HTML page named quote-price-history.html that I can open in my browser. For each of our part numbers, show a price history table for each supplier: RFQ number, quote date, quantity, unit, unit price, and the change from that supplier's last quote. Oldest at the top.

Rules for the script:
1. Write it in Python, in one file named quote_history.py. It must run with no internet and nothing to install.
2. At the top, write a few plain lines that say what goes in, what comes out, and how to run it.
3. Read every .json file in the folder I name. Skip lines that have no part number of ours.
4. Only compare prices that use the same unit from the same supplier. If the unit changed, say "unit changed" instead of working out a change.
5. Do not round, convert, or fix any number from the files. Show prices to 2 decimals.
6. If a file has bad data, stop and print one plain message that names the file, the field, and the value. Do not guess and do not skip it quietly.
7. Same files in, same page out, every time. Do not put today's date or anything random on the page.
8. At the bottom of the page, list the files it read.

Then run it on the files I attached and give me the HTML page. In plain words, with no code, tell me what the page shows and anything in my data that looked odd.
2. Change it, one thing at a time.
I attached quote_history.py and my quote files. Change the page it makes, one change only:

[WHAT YOU WANT TO SEE, in plain words]

Here is an example of what I mean:
[A SMALL TYPED TABLE, OR A SCREENSHOT WITH A CIRCLE ON IT]

Rules:
1. Change only what I asked for. Keep every other number, column, and the layout the same.
2. Do not change how the prices or the changes are worked out unless I asked.
3. Save the new script as quote_history_v[N].py and keep the old one as it is.
4. Run it on the attached files and give me the new page.
5. Then tell me in plain words, with no code: what you changed, and which numbers on the page moved, if any.
3. Check it against your answer key after every change.
I attached the page my script made from the sample quote files, and the answer key for those same files (price-history.md).
Check the page against the answer key, row by row: part, supplier, RFQ number, unit, unit price, and the change from the last quote.
Use the answer key as the truth. Do not fix anything and do not change the script.
Reply with a short table of every row that does not match, with what the page says and what the answer key says. If every row matches, say "All rows match" and how many rows you checked.
4. Fix it when it stops or looks wrong.
I ran quote_history.py on my quote files and it did not do what I expected. I attached the script and the files.

What I saw (the exact message, or a screenshot):
[PASTE THE MESSAGE OR ATTACH THE SCREENSHOT]

What I expected:
[ONE OR TWO PLAIN SENTENCES]

First, tell me in plain words what went wrong and whether the problem is in a data file or in the script.
If it is a data file: fix only the bad value or values in that file, tell me each old value and new value, and do not change the script to accept bad data.
If it is the script: fix only that problem, save it as a new version, and keep the old one.
Then run it again on all the files and give me the page. Tell me which numbers on the page moved, if any.
5. Save it as a skill when a version passes.
I attached quote_history_v5.py. It works, and I checked it against my sample answer key. Turn it into a Claude skill so it runs the same way every time.

1. Make a folder named quote-history with a SKILL.md file and the script inside a scripts folder. Do not change the script.
2. In SKILL.md, write short, plain steps: find the folder of quote .json files, run the script on that folder, give me the page, and if the script stops, show me its message and ask which value to fix. Never write or change the page by hand.
3. The description at the top should say when to use it, in the words I would use, like "update my quote price history" or "show price history for a part".
4. Zip the folder as quote-history.zip and give me the zip.
Or download the finished pieces: the script quote_history.py, the skill quote-history.zip, and the change note. Next month: drop the new RFQ file into quote-history, say "Update my quote price history," and check the newest row against the quote.
What's next?
- Compare supplier quotes the same way every time, which makes the quote files this report reads.
- Compare three supplier quotes, the quick chat version for a one-time look.
- Turn a messy ERP export into a clean report, the same idea for ERP data.
- Use AI to build the tool, not guess every answer, the idea behind this whole guide.
- What does deterministic mean?, why a script gives the same page every time.