- Your ERP system
Work tool. The company system that runs orders, inventory, and purchasing. Guides use exports from it, not a live link. - Claude
AI app. An AI chat app. You type or paste text, or add a file, and it writes back. - ChatGPT
AI app. An AI chat app. You type or paste text, or add a file, and it writes back.
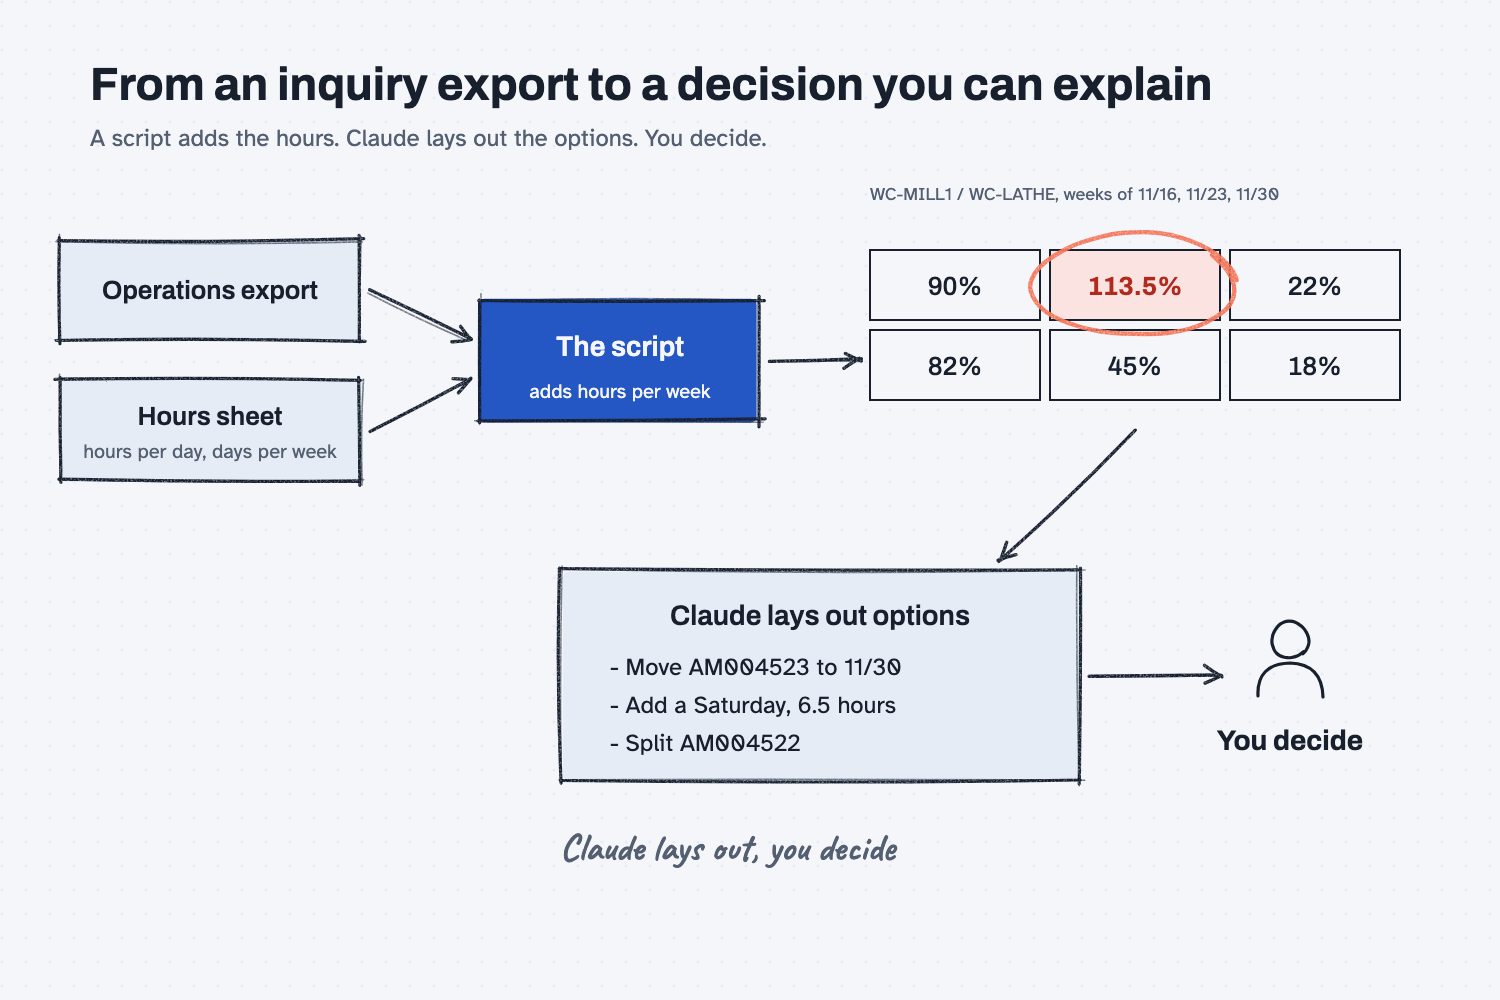
Answer. To check your shop's load from Acumatica, export a Generic Inquiry of open production operations, attach it with a sheet of the hours each work center can run, and have Claude write a script that adds up the hours per work center per week. When a week is over 100%, Claude lays out the options, and you decide.
Time and cost. About 25 minutes the first time, and about 10 minutes each week after. $0 to practice with the sample files on the free Claude plan. Who this is for. Planners, plant managers, and owners at a shop that runs Acumatica with production orders and wants to see an overloaded machine before the week starts, not halfway through it.
This guide follows Build a weekly dashboard from an Acumatica inquiry and uses the same method to feed a simple planner. Hector Lee, the planner at Mesquite Ridge Metal Works (a made-up company), has the inquiry "MR Open Operations," with one row for each step of each production order, and his own sheet of hours for the six work centers in the CNC bay. Thanksgiving week has only three working days, and on Monday the 16th he wants to know whether the manifold mill can carry what is planned for it.
What will I learn besides checking the load?
You will learn five habits that work for any planning check you build from ERP data, each with a short "why" later in this guide.
- Have AI build the tool once. Claude writes the script, and the script adds up the hours every week.
- Set bad rows aside, and never guess. Finished work, held orders, and blank hours go on a list with the reason.
- Check the first result against an answer key. You compare the grid with numbers you know are right.
- Let AI lay out the options, and you decide. Claude does the arithmetic for each choice, and the choice stays with you.
- Find the bottleneck first. One overloaded work center sets the pace for the whole bay, so that is where you look.
What do I need before I start?
You need Claude with file creation on, an operations export, and a sheet of the hours each work center can run. There is nothing to install.
- Claude at claude.ai, with file creation on. The free plan works for practice. If you have not set it up yet, follow Set up Claude first (about 10 minutes, once).
- Your export. For the Excel export, or to ask IT for a feed, follow Get your data out of Acumatica (about 10 minutes, once). You need an inquiry with one row per open production order operation, which your admin builds from the production order operations (the reference above has a short part on making a new Generic Inquiry); Manufacturing Edition also comes with work center inquiries your admin can start from. The steps assume Acumatica 2024 R2 or later.
- The sample files: acumatica-load-sample.zip, with the 11/16 operations export, Hector's
work-center-hours-2026-11.xlsx, and ananswer-keyfolder. See Download and unzip sample files if you need help with the zip.
Safe use. These files are made up. Real production data can show what you make for whom, so check your company's AI rules first. Read the safe use notes.
How do I check my shop's load from an Acumatica inquiry?
Export the inquiry, look at both files, have Claude build the load check, check it against the answer key, have Claude lay out the options for any week over 100%, and decide. There are six steps.
Step 1. Export the operations inquiry and save it with the date
In Acumatica, open your operations inquiry, set its filters, click Export to Excel, and rename the file with the date, like MR-Open-Operations-2026-11-16.xlsx. Keep it in the same folder as your hours sheet. For practice, unzip the sample.
Step 2. Look at both files before Claude does
Open both files, spend two minutes, and close them without saving. The hours sheet says how many hours a day each work center can run and how many working days each week has, so it is the only part of this check you type yourself. Thanksgiving week shows 3 working days, which means the manifold mill, WC-MILL1, has 48 hours that week instead of 80.
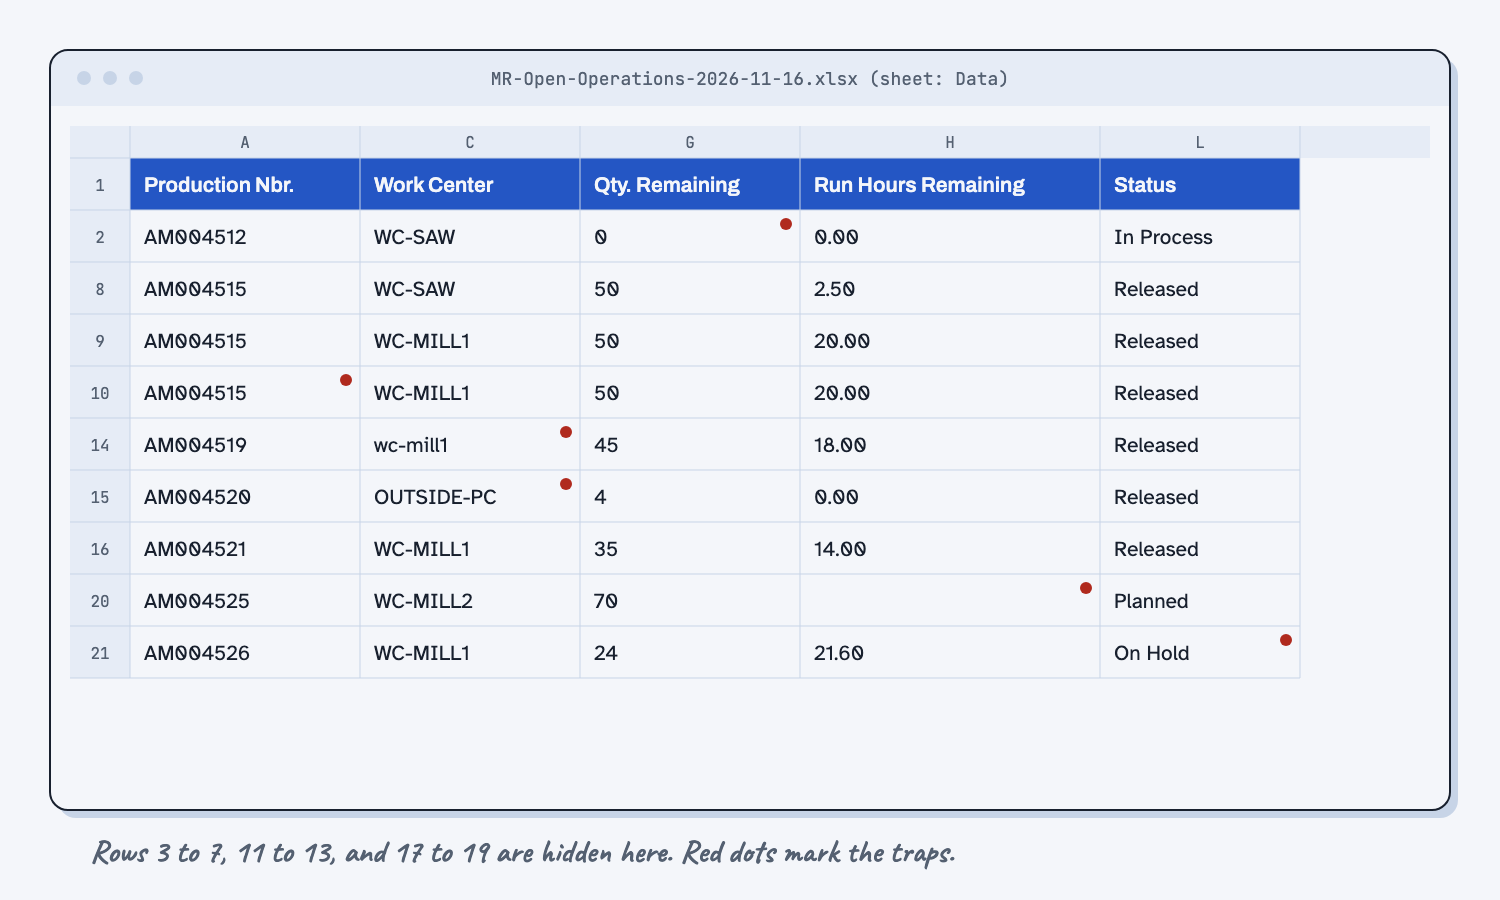
In the export, row 2 is a finished saw step that is still listed, and rows 9 and 10 are the same operation twice, from a join in the inquiry. Row 14 says "wc-mill1 " with a space, row 15 is powder coat sent to an outside shop, row 20 has no run hours, and row 21 belongs to an order on hold.
Step 3. Have Claude build the load check
Open a new chat at claude.ai, attach both files, and paste the prompt below. It asks Claude to map the columns first, then write load_check.py, a script that puts each operation's hours in the week it starts and compares each week with the hours available. The prompt ends by saying this is a check, not a schedule, so Claude does not start moving work around on its own.
The first attached file is an export of our Acumatica Generic Inquiry "MR Open Operations": one row per production order operation. The second is my sheet of the hours each work center can run per day, and the working days in each week. I want a load check: for each work center and each week, the hours of work loaded against the hours it can run.

First, write column-map.json that names the export column for each of these, using the exact column name text from row 1 of the Data sheet, and null if a column is missing: production_nbr, operation_id, work_center, inventory_id, qty_complete, qty_remaining, run_hours_remaining, setup_hours, start_date, end_date, status. Tell me which column you picked for each.

Then write load_check.py, a Python script I can run on every week's export. It reads column-map.json and finds every column by its name, never by its position, and stops with a plain message if a mapped column is missing. The as-of date is the date in the export's file name.

Rules:
- Count only operations with status Planned, Released, or In Process.
- Set a row aside, with its Excel row number and the reason, when: it has the same production number and operation ID as an earlier row (keep the first); its status is not one we count; its remaining quantity is 0 or less; its work center is not in my hours sheet; or its run hours remaining is blank. Never fill in a missing value.
- Take the spaces off the ends of every text value, and compare work centers in capital letters.
- An operation's hours are its run hours remaining, plus its setup hours only when quantity complete is 0.
- Put all of an operation's hours in the week (Monday to Sunday) of its start date. A start date before the as-of week counts in the as-of week, and goes on a "started late" list.
- Hours available in a week = hours per day times working days in that week, from my sheet.
- Show the three weeks in my sheet.

The script writes load-check-YYYY-MM-DD.html and load-check-YYYY-MM-DD.json. The page shows, in this order:
1. A grid: one row per work center, one column per week, each cell showing hours loaded, hours available, and the percent. Over 100% is marked OVER in red.
2. For each OVER cell, the operations in it: production number, operation, item, hours, start date, end date.
3. The "started late" list.
4. The rows set aside, with the reason.
5. One line: the export file name, the as-of date, and how many rows the export had.

This is a check, not a schedule. Do not move any work or suggest changes. Run it on the attached files, give me the page and the script to download, and tell me which work center weeks are over 100%.
Claude writes column-map.json and load_check.py, runs them, and gives you load-check-2026-11-16.html and a matching .json file. Download all four and open the page.
Step 4. Check the grid against the answer key
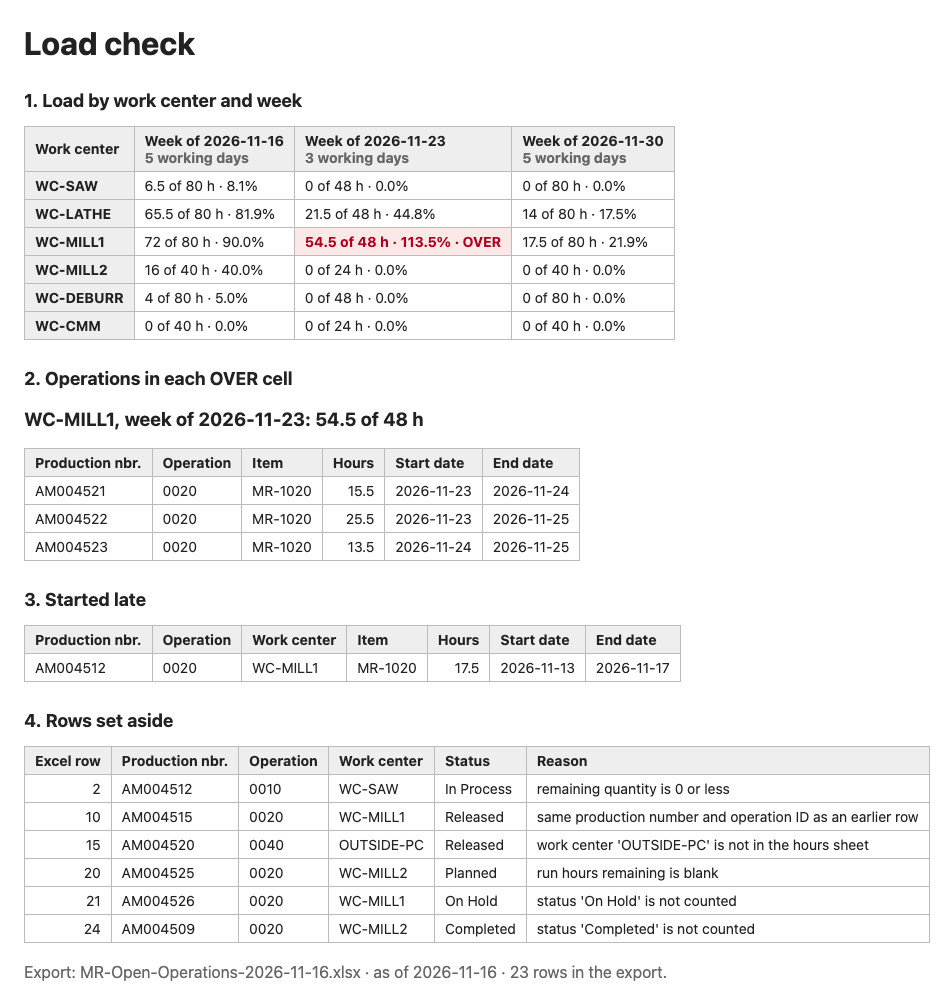
Open answer-key/key-load-check-2026-11-16.md and compare three things by hand:
- WC-MILL1, week of 11/23 should be 54.50 of 48 hours, 113.5%, the only cell over 100%.
- WC-MILL1, week of 11/16 should be 72.00 of 80 hours, 90.0%, including AM004512, which started on 11/13 and is on the "started late" list.
- Rows set aside should be 6, at Excel rows 2, 10, 15, 20, 21, and 24.
Then, in a new chat, attach load-check-2026-11-16.json and the answer key and paste the check prompt. (How to test an AI tool against answers you know.)
Check the attached output from my script against the attached answer key. Compare every number, every table row, and every row that was set aside, including the reasons.

Reply with:
1. One line: "All match" or "X differences".
2. A table of each difference: what it is, what my output says, what the answer key says.
3. Anything in my output that is not in the answer key at all, or the other way around.

Small wording differences in a reason are fine if they mean the same thing, but list them separately. Do not fix the script or the output. Only check.
If a number is off, do not use the page yet. Tell Claude which number is wrong and what the key says, and have it fix the script.
Step 5. Have Claude lay out the options
In the same chat, or a new one with the .json file attached, paste the options prompt. It asks for three kinds of fixes with the numbers worked out, and it tells Claude not to pick one, because you know things the file does not, like which customer can take a later date.
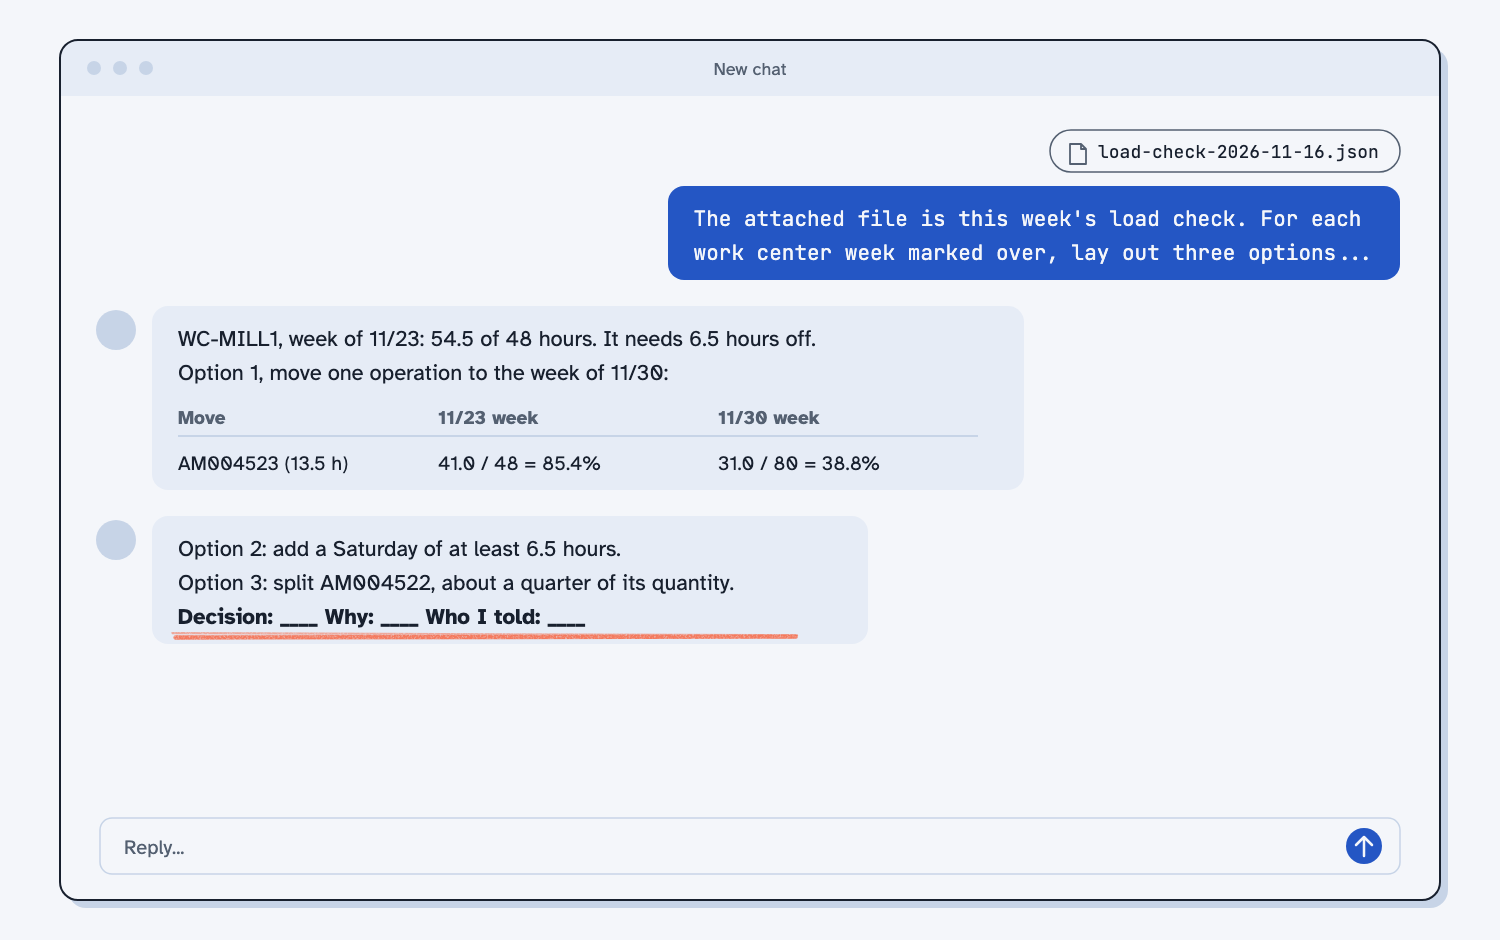
The attached file is this week's load check. For each work center week marked over, lay out three options to bring it back to 100% or less:
1. Move one or more of its operations, by production number, to the next week that has room on the same work center.
2. Add hours, such as a Saturday shift, and say how many hours are needed.
3. Split one operation, so part of the quantity runs the next week.

For each option, show the new hours and percent for every week it touches, worked out from the numbers in the file, and say in one line what it could put at risk, such as an end date that would move.

Do not pick an option and do not rank them. I decide. End with this line for me to fill in:
Decision: ____  Why: ____  Who I told: ____
On the sample, Claude worked out that the week needs 6.5 hours off, and showed each option's new numbers. Moving AM004523 to the next week takes WC-MILL1 to 41.0 of 48 hours (85.4%) and the week of 11/30 to 31.0 of 80 (38.8%). A Saturday shift needs at least 6.5 hours, and splitting AM004522 means moving about a quarter of its quantity. Claude also pointed out that the on-hold order on WC-MILL1 would add load if it is released.
Step 6. Decide, write it down, and change the dates yourself
Pick the option that fits what you know, and fill in the decision line. Hector's reads: "Decision: move AM004523 to Mon 11/30. Why: it is the smallest job that fixes the week, and no Saturday crew is free. Who I told: Ray, Alicia." Then change the date on the production order in Acumatica yourself, and keep the line in a decision log next to the week's export, because next month you will want to know why a date moved. If you want to test a choice before you make it, a shop twin can run the week both ways, which is what Turn your open-orders export into a twin orders file sets up.
What does good look like?
With the sample files, the load check shows one overloaded week. Answer key, sample data. You can open the sample load check to compare.
| Work center | Week of 11/16 | Week of 11/23 | Week of 11/30 |
|---|---|---|---|
| WC-LATHE | 65.5 of 80 (81.9%) | 21.5 of 48 (44.8%) | 14.0 of 80 (17.5%) |
| WC-MILL1 | 72.0 of 80 (90.0%) | 54.5 of 48 (113.5%) OVER | 17.5 of 80 (21.9%) |
| WC-MILL2 | 16.0 of 40 (40.0%) | 0 of 24 | 0 of 40 |
The saw, deburr bench, and CMM stay under 10% every week, so the mill in the short week is the only problem, and it is easy to miss when you look at orders instead of weeks.
What can go wrong?
These came up while building and testing this check, and each one is a reason to look twice.
- The script needs a library outside Claude. The script Claude wrote reads Excel with a library called openpyxl, which Claude already has. If someone runs it on their own computer, they need to install it first.
- Work past the last week drops off the grid. An operation that starts after the weeks in your hours sheet is left out, so add the next weeks to the sheet each month.
- An order on hold can come back. The held order on WC-MILL1 is not counted, but if someone releases it, the mill is over in a second week, so check the set-aside list.
- A split adds a setup. Claude's split option assumed hours scale with quantity, and a second run usually needs its own setup, so add that time before you choose it.
- Setup counted twice or not at all. The prompt counts setup only when nothing is complete yet, and if your shop counts it differently, change that rule before you trust the grid.
How do I check the answer?
Check the grid against the export and the answer key, never against Claude's summary.
- The rows in the export equal the operations loaded plus the rows set aside (23 = 17 + 6 on the sample).
- Each set-aside row has a reason you can see in the export.
- Three cells you pick match the answer key by hand, and the check prompt finds no differences.
- Each option's new numbers add up from the grid, such as 54.5 minus 13.5 is 41.0.
Why does this way work?
It works because the arithmetic goes to a script that does it the same way every week, and the judgment stays with the person who knows the customers and the crew. Here is the "why" behind each habit.
Have AI build the tool once. Adding up hours by week is exact work, so it belongs in a script, which gives the same grid from the same export every time. That is what deterministic means, and Claude only has to write the script once.
Set bad rows aside, and never guess. A finished step or a repeated row makes the mill look busier than it is, and a blank hours cell makes it look emptier. Each odd row goes on a list a person reads, which is cleaning the data before it goes in.
Check the first result against an answer key. A grid can look reasonable and still count one order twice, but with known numbers for the sample, that shows up right away. (Test an AI tool against answers you know.)
Let AI lay out the options, and you decide. Claude is quick at the "what if we move this one" arithmetic, while you know which customer can wait and who can work Saturday. That split, where you plan and decide and AI does the legwork, is humans plan, AI does. A tool that weighs choices against a goal like this is a simple cousin of an optimizer, with you as the one who sets the goal.
Find the bottleneck first. The bay can only ship what its busiest work center can make, so the one red cell matters more than every green one. (Find the bottleneck first.)
Frequently asked questions
Is this a schedule?
No. It is a check that puts each operation's hours in the week it starts, which is enough to see an overloaded week coming. A schedule decides the order of jobs hour by hour, and for that, or to test a change before you make it, a digital twin is the next step.
Why keep the hours sheet outside Acumatica?
Because it is the one number you know better than the system does this month, such as a holiday, a machine down for repair, or a crew short. Change the sheet, and the next run uses it.
Can I run it on next week's export?
Yes. Attach the new export, the hours sheet, load_check.py, and column-map.json, and say "Run load_check.py on this week's export. Do not change the script or the map." Then do Steps 4 to 6 for any red cell.
Take this with you
Three prompts and one routine turn any operations export into a load check and a decision you can explain.
1. Build the load check. Change the inquiry name, the statuses you count, and the setup rule to fit your shop.
The first attached file is an export of our Acumatica Generic Inquiry "MR Open Operations": one row per production order operation. The second is my sheet of the hours each work center can run per day, and the working days in each week. I want a load check: for each work center and each week, the hours of work loaded against the hours it can run.

First, write column-map.json that names the export column for each of these, using the exact column name text from row 1 of the Data sheet, and null if a column is missing: production_nbr, operation_id, work_center, inventory_id, qty_complete, qty_remaining, run_hours_remaining, setup_hours, start_date, end_date, status. Tell me which column you picked for each.

Then write load_check.py, a Python script I can run on every week's export. It reads column-map.json and finds every column by its name, never by its position, and stops with a plain message if a mapped column is missing. The as-of date is the date in the export's file name.

Rules:
- Count only operations with status Planned, Released, or In Process.
- Set a row aside, with its Excel row number and the reason, when: it has the same production number and operation ID as an earlier row (keep the first); its status is not one we count; its remaining quantity is 0 or less; its work center is not in my hours sheet; or its run hours remaining is blank. Never fill in a missing value.
- Take the spaces off the ends of every text value, and compare work centers in capital letters.
- An operation's hours are its run hours remaining, plus its setup hours only when quantity complete is 0.
- Put all of an operation's hours in the week (Monday to Sunday) of its start date. A start date before the as-of week counts in the as-of week, and goes on a "started late" list.
- Hours available in a week = hours per day times working days in that week, from my sheet.
- Show the three weeks in my sheet.

The script writes load-check-YYYY-MM-DD.html and load-check-YYYY-MM-DD.json. The page shows, in this order:
1. A grid: one row per work center, one column per week, each cell showing hours loaded, hours available, and the percent. Over 100% is marked OVER in red.
2. For each OVER cell, the operations in it: production number, operation, item, hours, start date, end date.
3. The "started late" list.
4. The rows set aside, with the reason.
5. One line: the export file name, the as-of date, and how many rows the export had.

This is a check, not a schedule. Do not move any work or suggest changes. Run it on the attached files, give me the page and the script to download, and tell me which work center weeks are over 100%.
2. Check it against an answer key.
Check the attached output from my script against the attached answer key. Compare every number, every table row, and every row that was set aside, including the reasons.

Reply with:
1. One line: "All match" or "X differences".
2. A table of each difference: what it is, what my output says, what the answer key says.
3. Anything in my output that is not in the answer key at all, or the other way around.

Small wording differences in a reason are fine if they mean the same thing, but list them separately. Do not fix the script or the output. Only check.
3. Lay out the options for an overloaded week.
The attached file is this week's load check. For each work center week marked over, lay out three options to bring it back to 100% or less:
1. Move one or more of its operations, by production number, to the next week that has room on the same work center.
2. Add hours, such as a Saturday shift, and say how many hours are needed.
3. Split one operation, so part of the quantity runs the next week.

For each option, show the new hours and percent for every week it touches, worked out from the numbers in the file, and say in one line what it could put at risk, such as an end date that would move.

Do not pick an option and do not rank them. I decide. End with this line for me to fill in:
Decision: ____  Why: ____  Who I told: ____
Every Monday: export the inquiry, update the hours sheet for holidays or repairs, run the script, read the set-aside list, and for each red cell, lay out the options, decide, and log the decision. The tested pieces are load_check.py and column-map.json.
What's next?
- Build a weekly dashboard from an Acumatica inquiry, the guide before this one: the same method for open sales orders.
- Turn your open-orders export into a twin orders file, which feeds your orders to a shop twin so you can run what-ifs.
- Find the bottleneck and test your bad days, which tests the busiest machine in the twin.
- Find the bottleneck first, the idea behind looking at one red cell.
- What is an optimizer?, for when you want a tool to weigh the options too.