- Your ERP system
Work tool. The company system that runs orders, inventory, and purchasing. Guides use exports from it, not a live link. - Claude
AI app. An AI chat app. You type or paste text, or add a file, and it writes back. - ChatGPT
AI app. An AI chat app. You type or paste text, or add a file, and it writes back.
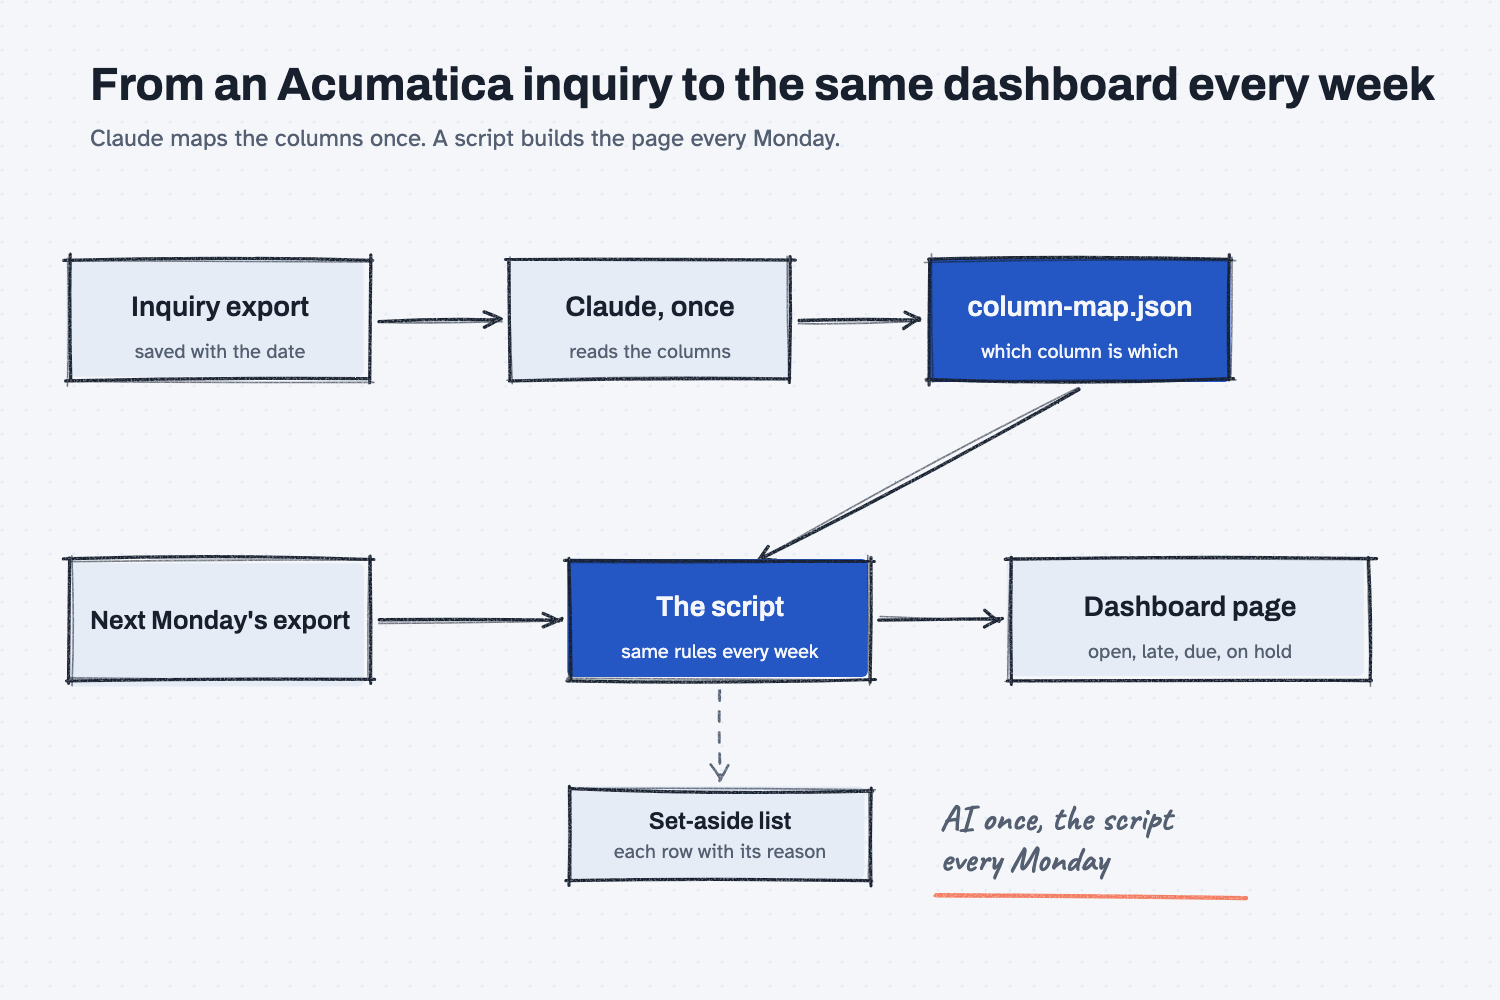
Answer. To build a weekly dashboard from an Acumatica Generic Inquiry, export the inquiry to Excel, have Claude read it once and write a column map, then have Claude write a script that turns any week's export into the same dashboard page. You check the first page against an answer key, and every Monday after that, the script does the work.
Time and cost. About 25 minutes the first time, and about 5 minutes each week after. $0 to practice with the sample files on the free Claude plan. Who this is for. Planners, plant managers, controllers, and owners at a company that runs Acumatica and wants one page on open orders every Monday, without building it by hand.
In Acumatica, a Generic Inquiry (most people say "GI") is a saved list of records your admin set up, such as every open sales order line. Exporting it takes one click, but then someone spends Monday morning deleting quotes and fixing dates, and the numbers differ depending on who did it. In this guide, Hector Lee, the planner at Mesquite Ridge Metal Works (a made-up company), turns the inquiry "MR Open Sales Lines" into a dashboard of open value, late lines, what is due this week, and what is on hold. Claude reads the export once, and a script does the rest the same way every week.
What will I learn besides building a dashboard?
You will learn five habits that work for any report you build from an ERP export, each with a short "why" later in this guide.
- Map the columns once. Claude reads the export and writes down which column holds each thing the dashboard needs.
- Have AI build the tool once. Claude writes the script, and the script builds the page every week.
- Set bad rows aside, and never guess. Quotes, duplicates, and blank dates go on a list with the reason, not into the totals.
- Check the first page against an answer key. You compare it with numbers you know are right before you trust it.
- Run the same script every week. Next Monday's page comes from the same rules, so the numbers can be compared.
What do I need before I start?
You need Claude with file creation on, and either your own inquiry export or the sample files below. There is nothing to install.
- Claude at claude.ai, with file creation on so it can run code. The free plan works for practice. If you have not set it up yet, follow Set up Claude first (about 10 minutes, once), and see Attach files to a chat if you have not attached a file before.
- Your export. To export your own inquiry, or to ask IT for a feed that refreshes on its own, follow Get your data out of Acumatica (about 10 minutes, once). The steps in this guide assume Acumatica 2024 R2 or later, and the Excel export works the same way in older versions.
- The sample files: acumatica-dashboard-sample.zip. Inside are two exports of the made-up inquiry "MR Open Sales Lines", one from Monday 11/16 and one from Monday 11/23, plus an
answer-keyfolder. If you need help with the zip, see Download and unzip sample files.
Safe use. Real exports hold customer names and prices. Check your company's AI rules before you attach one, and practice with the sample files first. Read the safe use notes.
How do I build a weekly dashboard from an Acumatica inquiry?
Export the inquiry, look at it, have Claude map the columns, have Claude build the script, check the page against the answer key, and run it on next week's export. There are six steps.
Step 1. Export the inquiry and save it with the date
In Acumatica, open your inquiry, set its filters, and click Export to Excel on the table toolbar. Rename the file with the date, like MR-Open-Sales-Lines-2026-11-16.xlsx, and keep it in one folder for this job, because the script reads the date from the file name. For practice, unzip the sample files and use the 11/16 export.
Step 2. Look at the export before Claude does
Open the export in Excel, spend two minutes on it, and close it without saving. You will check Claude's work against what you see here, so it helps to know the traps first.
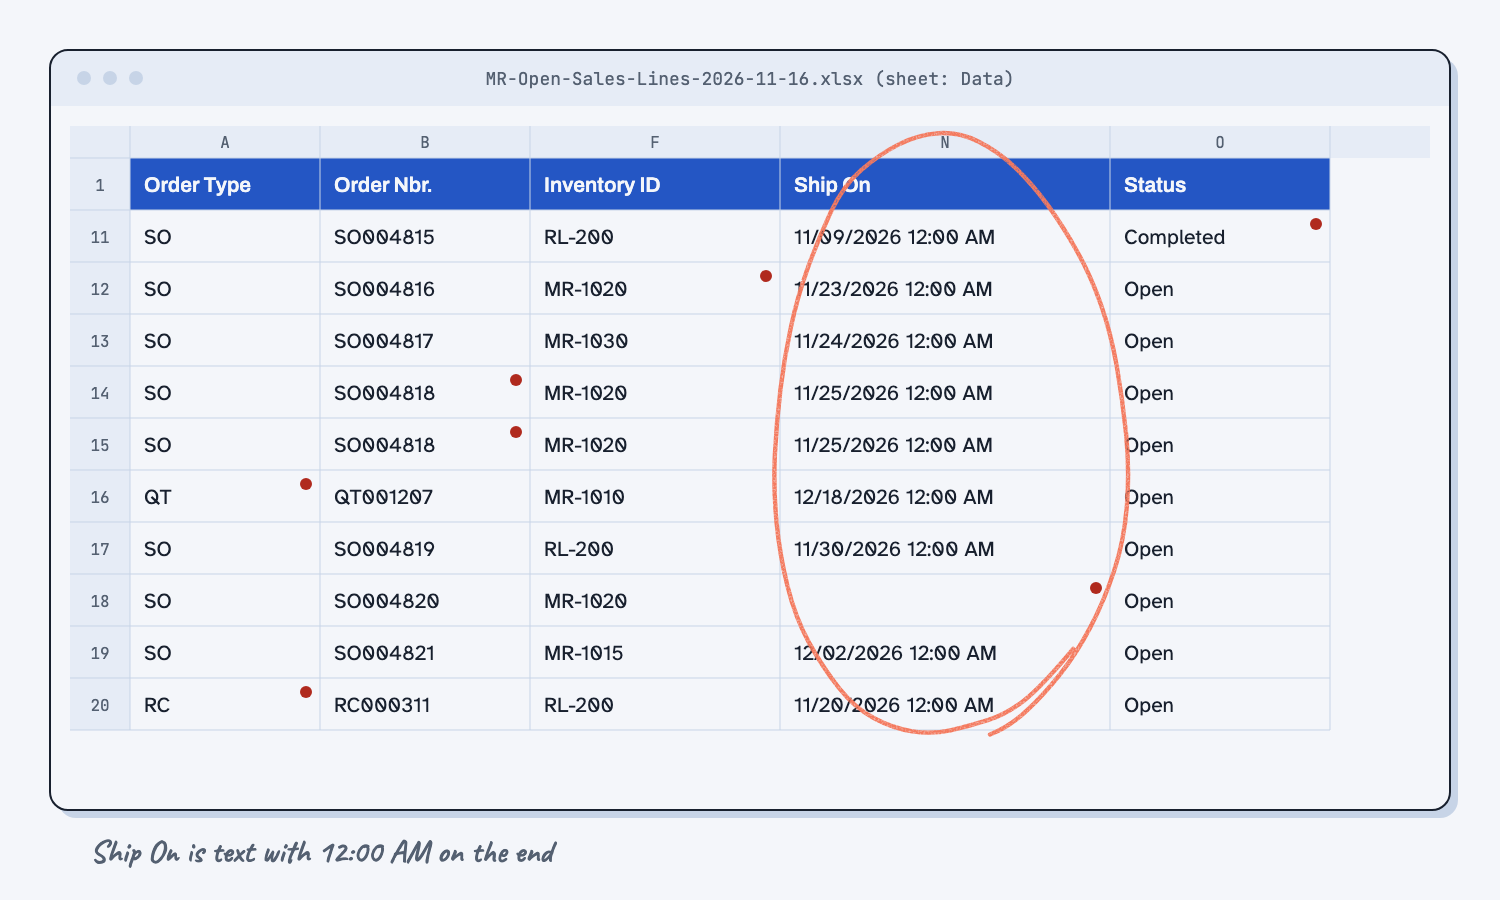
The column names are on row 1, with dots and all ("Order Nbr.", "Open Qty."). Row 16 is a QT quote and row 20 is an RC return, and neither is an order you will ship. Rows 14 and 15 are the same line twice, which happens when an inquiry joins a second table. Ship On holds text like "11/17/2026 12:00 AM" instead of real dates, and row 18 has none. On SO004811, 120 were ordered but only 80 are open, while Ext. Price still counts all 120.
Step 3. Have Claude map the columns once
Open a new chat at claude.ai, attach the export, and paste the prompt below. Claude writes column-map.json, a small file that says which column holds each thing the dashboard needs. Its last two lists are your rules, which order types are real orders and which statuses count as open, so change them if your company counts differently.
The attached file is an export of our Acumatica Generic Inquiry "MR Open Sales Lines", made with Export to Excel. I want to build a weekly open orders dashboard from this export, and first I need a column map.

Read the column names on row 1 of the Data sheet. Then write column-map.json with exactly this shape, using the exact column name text from the export (dots and spaces included), and null when you cannot find a column:

{
  "inquiry": "MR Open Sales Lines",
  "sheet": "Data",
  "fields": {
    "order_type": "...",
    "order_nbr": "...",
    "line_nbr": "...",
    "customer_name": "...",
    "inventory_id": "...",
    "open_qty": "...",
    "unit_price": "...",
    "ship_date": "...",
    "status": "..."
  },
  "order_types_counted": ["SO"],
  "open_statuses": ["Open", "Back Order", "On Hold"]
}

ship_date is the date we promised to ship. open_qty is the quantity still to ship, not the ordered quantity.

Do not change the export. Then tell me in plain words:
1. Which column you picked for each field, and any field where two columns could fit.
2. Every value you see in the order type column and the status column, with a count of rows for each.
3. How the dates are written in the ship date column, and anything odd you see, such as text instead of dates, blanks, extra spaces, or the same order line twice.
Do not build the dashboard yet.
Claude tells you which column it picked for each field, every order type and status with a count, and the odd things it saw. Read that against what you saw in Step 2.
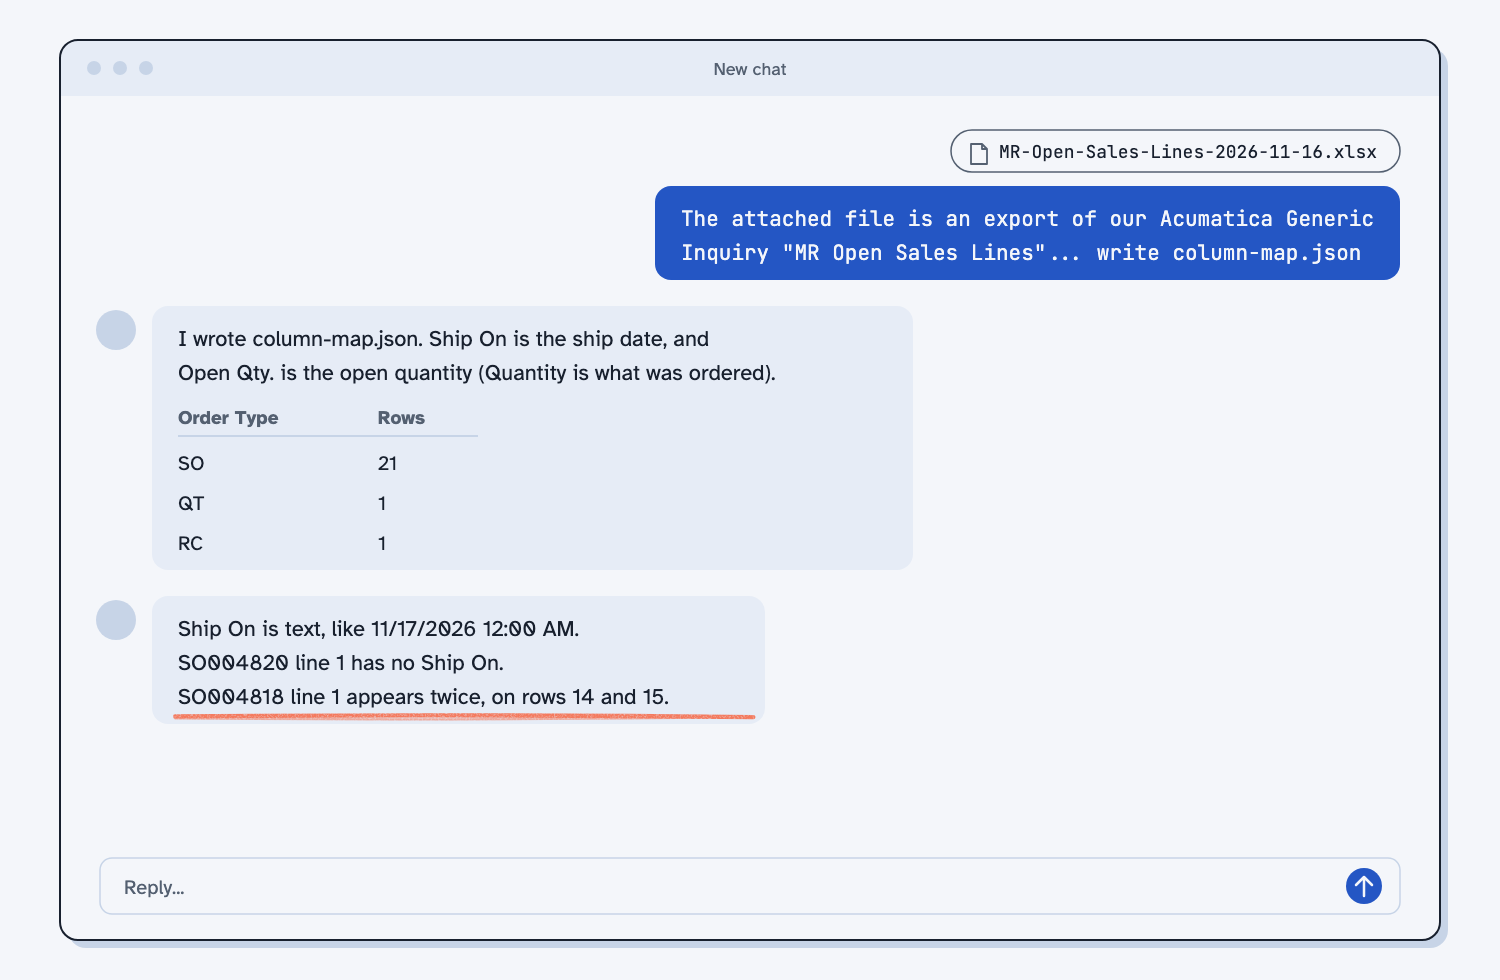
Claude may suggest its own rule, such as showing the blank ship date as "No ship date." That is your call, so decide now and keep your rule in the next prompt. Download column-map.json.
Step 4. Have Claude write the dashboard script
In the same chat, paste the build prompt. It describes the page you want, not the code, and gives the rules for which rows count. The key line says to find every column by its name, never by its position, because admins add columns to inquiries and a script that counts columns would quietly read the wrong one. (Describe the output, not the code.)
Build me a weekly open orders dashboard from the attached Acumatica export and column-map.json. Write it as a Python script, open_orders_dashboard.py, that I can run on every week's export, so the page comes out the same way each time.

How the script works:
1. It takes the export file as its input and reads column-map.json from the same folder. It finds every column by its name in the map, never by its position, because our admin sometimes adds columns. If a column in the map is missing, it stops and says which one.
2. The as-of date is the date in the file name (MR-Open-Sales-Lines-YYYY-MM-DD.xlsx).
3. It writes dashboard-YYYY-MM-DD.html, one page that opens in a browser with no internet, and dashboard-YYYY-MM-DD.json with the same numbers.

Rules for the rows:
- Set a row aside, with its Excel row number and the reason, when: its order type is not in order_types_counted; it has the same order number and line number as an earlier row (keep the first); its status is not in open_statuses; its open quantity is 0 or less; or its ship date is blank or not a date. Never fill in a missing value.
- Ship dates may be text with a time on the end, like "11/20/2026 12:00 AM". Read the date part only.
- Take the spaces off the ends of every text value.
- Open value is open quantity times unit price. Do not use the Ext. Price column, because it counts what has already shipped.

What the page shows, in this order:
1. Four numbers across the top: open lines and open value, late lines and late value (ship date before the as-of date), lines due this week and their value (as-of date to 6 days after), and lines on hold and their value.
2. A table by customer name, A to Z: open lines, open value, late lines, late value.
3. A table of late lines, oldest ship date first: order, line, customer, item, open qty, open value, ship date, days late.
4. A table of rows set aside: Excel row, order, line, reason.
5. One line at the bottom: the export file name, the as-of date, and how many rows the export had.
Money with a dollar sign and two decimals. Plain, readable layout that prints on one page if it can.

Run it on the attached export, then give me the HTML page and the script to download, and tell me the four top numbers and how many rows you set aside.
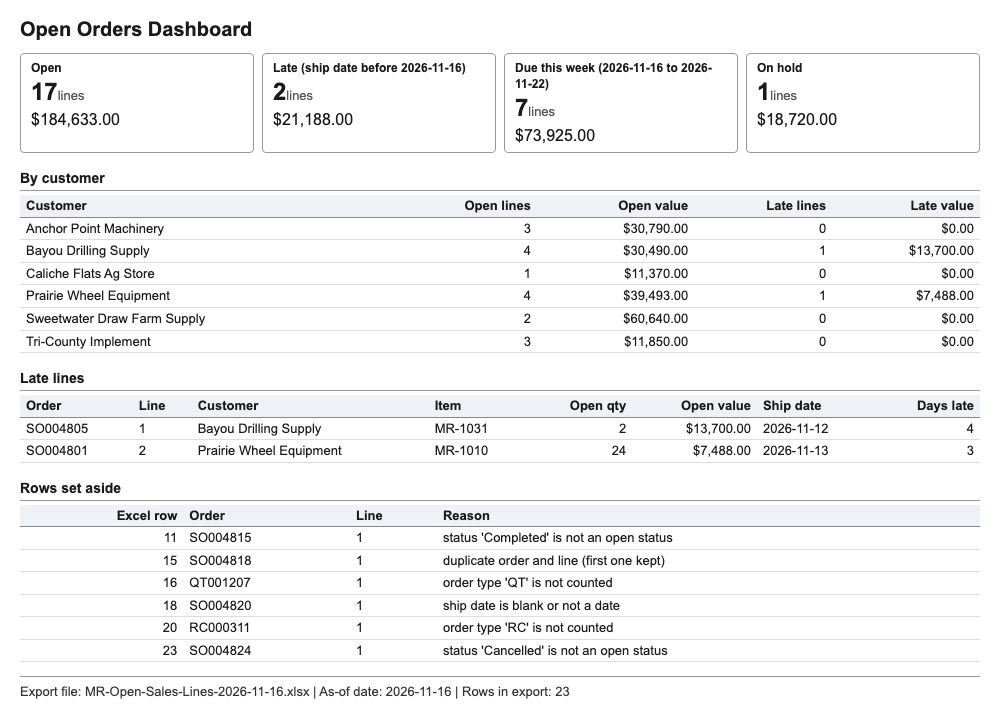
Claude writes open_orders_dashboard.py, runs it, and gives you dashboard-2026-11-16.html and a matching .json file. Download all three and double-click the page to open it in your browser.
Step 5. Check the page against the answer key
Check the page against numbers you know are right before you trust it. Open answer-key/key-dashboard-2026-11-16.md from the sample and compare three things by hand:
- Open value should be $184,633.00. If it is $188,093.00, the script used Ext. Price, which counts the 40 drive shafts that already shipped on SO004811.
- Late lines should be 2: SO004805 (Bayou Drilling Supply, 4 days late) and SO004801 line 2 (Prairie Wheel Equipment, 3 days late).
- Rows set aside should be 6, at Excel rows 11, 15, 16, 18, 20, and 23.
Then, in a new chat, attach dashboard-2026-11-16.json and the answer key and paste the check prompt, which compares every row. (How to test an AI tool against answers you know.)
Check the attached output from my script against the attached answer key. Compare every number, every table row, and every row that was set aside, including the reasons.

Reply with:
1. One line: "All match" or "X differences".
2. A table of each difference: what it is, what my output says, what the answer key says.
3. Anything in my output that is not in the answer key at all, or the other way around.

Small wording differences in a reason are fine if they mean the same thing, but list them separately. Do not fix the script or the output. Only check.
On the sample, Claude replied "All match" and listed reasons worded differently from the key, such as "order type 'QT' is not counted," which mean the same thing. If a number does not match, do not keep the script. Tell Claude which number is wrong and what the key says, and have it fix the script.
Step 6. Run it on next week's export
Start a new chat, attach open_orders_dashboard.py, column-map.json, and the 11/23 sample export, and send this:
Run open_orders_dashboard.py on this week's export, MR-Open-Sales-Lines-2026-11-23.xlsx, with column-map.json. Do not change the script or the map. If the script stops, tell me its message and do not work around it. Give me the page to download and the four top numbers.
The admin added a Salesperson column to the inquiry that week, and the script still reads the export correctly because it finds columns by name. The key, answer-key/key-dashboard-2026-11-23.md, says 15 open lines worth $157,043.00 and 3 late lines worth $33,058.00. Keep the script, the map, and every week's export in one folder.
What does good look like?
With the 11/16 sample export, the dashboard shows these numbers. Answer key, sample data. You can open the sample dashboard to compare.
| Box | Lines | Value |
|---|---|---|
| Open | 17 | $184,633.00 |
| Late (Ship On before 11/16) | 2 | $21,188.00 |
| Due this week (11/16 to 11/22) | 7 | $73,925.00 |
| On hold | 1 | $18,720.00 |
The on-hold line also counts in the open total, because it is still an order you owe, so the boxes overlap on purpose.
What can go wrong?
These came up while building and testing this dashboard, and each one is a reason to check.
- The open value is too high. The script added up Ext. Price, which counts what already shipped, so keep the prompt line that says Open Qty. times Unit Price.
- Claude's summary does not match the page. In one test, the chat reply said a blank ship date "says Open," while the page and the .json file correctly said it was blank, so check the page, not the description.
- The answer key has the same name as your output. A key named like the output confused Claude about which file was which, which is why the sample keys start with
key-. - Someone renames a column in the inquiry. The script stops with "column 'Ship On' is missing from the export," and you fix the name in
column-map.json, not in the script. - A new order type or status shows up. The script sets it aside, so read the set-aside list each week and add it to the map if it should count.
- The dates look one day early. That comes from the time zone setting in Acumatica, and Get your data out of Acumatica covers the fix.
How do I check the answer?
Check the page against the export and the answer key, never against Claude's summary.
- The rows in the export equal the open lines plus the rows set aside (23 = 17 + 6 on the sample).
- Each set-aside row has a reason you can see in the export.
- Three numbers you pick match the answer key by hand, and the check prompt says "All match."
- Next week's page is built by the same script, with the script and the map unchanged.
Why does this way work?
It works because the fuzzy part, reading the column names, happens once, and the repeat work goes to a script. Here is the "why" behind each habit.
Map the columns once. Claude is good at reading column names like "Open Qty." and "Ship On," and you are good at saying what counts as open, so the map holds both in one small file. It also makes a later move to a live feed easy, because only the map changes. (How AI connects to your systems.)
Have AI build the tool once. Asked for the dashboard every Monday, Claude would rebuild the page from scratch, and the numbers could drift. A script gives the same output for the same input, which is what deterministic means, and you only describe the page you want, not the code.
Set bad rows aside, and never guess. A quote in the totals or a line counted twice makes a page that looks fine and is wrong, so each odd row goes on a list a person reads, which is cleaning the data before it goes in.
Check the first page against an answer key. A tidy page can still be wrong, but with known right numbers a wrong total shows up in minutes. (Test an AI tool against answers you know.)
Run the same script every week. The script applies your rules the same way every Monday, so this week's late total can be compared with last week's. You plan and check, and the tool does the repeat work, which is humans plan, AI does.
Frequently asked questions
My inquiry has different columns. Does this still work?
Yes. Run the map prompt on your own export and Claude picks your column names, so if your inquiry says "Promised Date," the map says so and the build prompt does not change.
Can I pull the inquiry straight from Acumatica instead of exporting it?
Yes, once IT turns on OData for that inquiry and gives you a read-only login, and you update the map for the feed's shorter column names. Get your data out of Acumatica has the request to send IT, and What is an API? explains the idea.
Can I just ask Claude questions about the export instead?
Yes, for a one-time question like "which customer has the most late lines?" (Ask your data in plain words.) For a page you compare week to week, use the script, because it gives the same answer from the same file.
Can I use ChatGPT instead?
Yes, if your plan can run code and hand back files, because the prompts are plain text and the script is plain Python.
Take this with you
Three prompts and the Monday routine turn any inquiry export into the same checked page every week.
1. Map the columns once. Change the inquiry name and the two lists of rules.
The attached file is an export of our Acumatica Generic Inquiry "MR Open Sales Lines", made with Export to Excel. I want to build a weekly open orders dashboard from this export, and first I need a column map.

Read the column names on row 1 of the Data sheet. Then write column-map.json with exactly this shape, using the exact column name text from the export (dots and spaces included), and null when you cannot find a column:

{
  "inquiry": "MR Open Sales Lines",
  "sheet": "Data",
  "fields": {
    "order_type": "...",
    "order_nbr": "...",
    "line_nbr": "...",
    "customer_name": "...",
    "inventory_id": "...",
    "open_qty": "...",
    "unit_price": "...",
    "ship_date": "...",
    "status": "..."
  },
  "order_types_counted": ["SO"],
  "open_statuses": ["Open", "Back Order", "On Hold"]
}

ship_date is the date we promised to ship. open_qty is the quantity still to ship, not the ordered quantity.

Do not change the export. Then tell me in plain words:
1. Which column you picked for each field, and any field where two columns could fit.
2. Every value you see in the order type column and the status column, with a count of rows for each.
3. How the dates are written in the ship date column, and anything odd you see, such as text instead of dates, blanks, extra spaces, or the same order line twice.
Do not build the dashboard yet.
2. Build the dashboard script. Change the boxes and tables if you want different ones, but keep the rules for the rows.
Build me a weekly open orders dashboard from the attached Acumatica export and column-map.json. Write it as a Python script, open_orders_dashboard.py, that I can run on every week's export, so the page comes out the same way each time.

How the script works:
1. It takes the export file as its input and reads column-map.json from the same folder. It finds every column by its name in the map, never by its position, because our admin sometimes adds columns. If a column in the map is missing, it stops and says which one.
2. The as-of date is the date in the file name (MR-Open-Sales-Lines-YYYY-MM-DD.xlsx).
3. It writes dashboard-YYYY-MM-DD.html, one page that opens in a browser with no internet, and dashboard-YYYY-MM-DD.json with the same numbers.

Rules for the rows:
- Set a row aside, with its Excel row number and the reason, when: its order type is not in order_types_counted; it has the same order number and line number as an earlier row (keep the first); its status is not in open_statuses; its open quantity is 0 or less; or its ship date is blank or not a date. Never fill in a missing value.
- Ship dates may be text with a time on the end, like "11/20/2026 12:00 AM". Read the date part only.
- Take the spaces off the ends of every text value.
- Open value is open quantity times unit price. Do not use the Ext. Price column, because it counts what has already shipped.

What the page shows, in this order:
1. Four numbers across the top: open lines and open value, late lines and late value (ship date before the as-of date), lines due this week and their value (as-of date to 6 days after), and lines on hold and their value.
2. A table by customer name, A to Z: open lines, open value, late lines, late value.
3. A table of late lines, oldest ship date first: order, line, customer, item, open qty, open value, ship date, days late.
4. A table of rows set aside: Excel row, order, line, reason.
5. One line at the bottom: the export file name, the as-of date, and how many rows the export had.
Money with a dollar sign and two decimals. Plain, readable layout that prints on one page if it can.

Run it on the attached export, then give me the HTML page and the script to download, and tell me the four top numbers and how many rows you set aside.
3. Check it against an answer key.
Check the attached output from my script against the attached answer key. Compare every number, every table row, and every row that was set aside, including the reasons.

Reply with:
1. One line: "All match" or "X differences".
2. A table of each difference: what it is, what my output says, what the answer key says.
3. Anything in my output that is not in the answer key at all, or the other way around.

Small wording differences in a reason are fine if they mean the same thing, but list them separately. Do not fix the script or the output. Only check.
Every Monday: export the inquiry, save it with the date, attach it with the script and the map, send the Step 6 line, and read the set-aside list. The tested pieces are open_orders_dashboard.py and column-map.json.
What's next?
- Check your shop's load from an Acumatica inquiry, the next guide: use an inquiry export to see which work center is overloaded next week.
- Have Claude build your quote report, the same "describe the page, check it, keep version 1" method for quote files.
- Turn your open-orders export into a twin orders file, which feeds the same kind of export into a shop twin.
- Turn a messy ERP export into a clean report, a quick one-time clean-up in a chat.
- What does deterministic mean?, the idea behind keeping the math in a script.